How is Antarctic melt contributing to global sea level?
There’s currently around 25 million cubic kilometres of water locked up in the ice sheet covering the Antarctic continent. That’s 30 x 1018 (30 with another 18 zeros after it) litres. This is a lot of water, and it would equate to around 58 metres of sea level rise if the entire sheet were to melt—more than enough to inundate coastal cities around the world. Melting of the entire ice sheet takes many thousands of years, though, so this absolute worst-case scenario won’t become a reality anytime soon.
But the future behaviour of the Antarctic ice sheet is one of the big factors determining future sea level rise. We need to know how likely it is to melt, how much of it will melt, and how fast.

It’s difficult to come up with an accurate estimate of the likely contribution of the Antarctic ice sheet to sea level in the future. However, the recipient of the Australian Academy of Science Mawson Medal for 2018, Professor Matt King, has been working on these questions using satellite data to study changes in gravity and the overall shape of Earth’s surface to improve our knowledge of the Antarctic ice sheet’s past and current contribution to sea level rise.
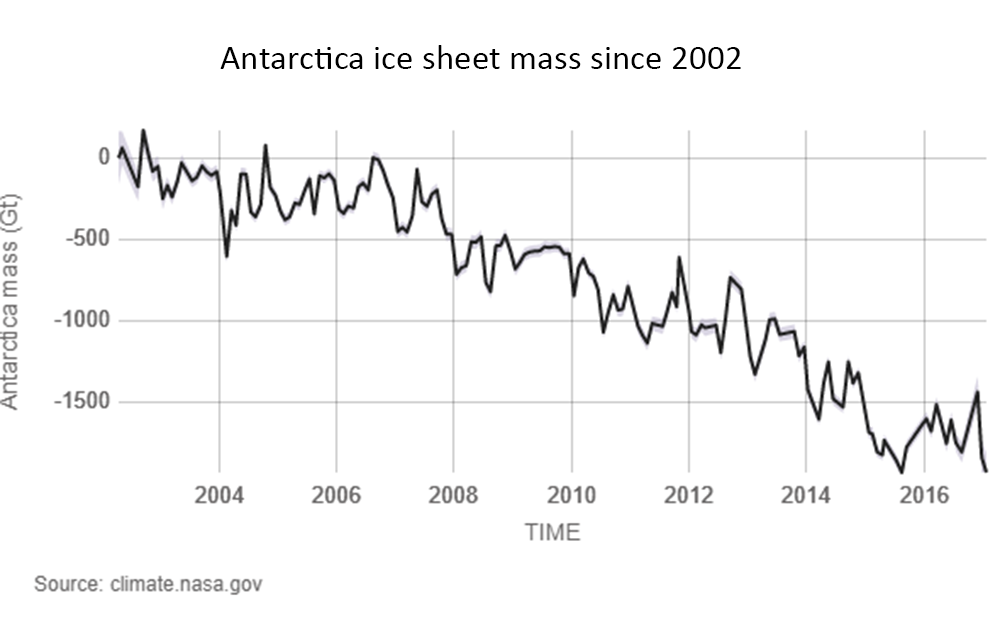
Using measurements from the Gravity Recovery and Climate Experiment (GRACE) satellites, Professor King and his colleagues examined changes in gravity, and therefore changes in mass (the gravitational pull of an object is dependent on its mass) over time in the Antarctic region. Using this information, they calculated the change in ‘weight’ of the Antarctic ice sheet and were able to calculate how much ice has been lost into the ocean through melting.

It’s not quite as simple as it sounds.
The thing about ice sheets is that they’re heavy—25 million cubic kilometres of water weighs 25 x 1015 tonnes. This burden pushes down on the solid rock beneath it, and ‘squishes’ the underlying mantle layer. As the mantle is plastic (plastic meaning it can be shaped or moulded, not made of plastic as in a plastic bag or a Lego brick) and can deform, it ‘flows’ laterally away from the region of downward pressure exerted by the overlying ice sheet. This ‘thinning’ of the mantle means the overlying crustal rock beneath the ice sheet sinks a little.
When the ice sheet melts, it loses mass, and so exerts less of a load on the rock underneath. The underlying mantle then flows back, pushing the rock beneath the ice sheet up higher again. This whole process is called glacial isostatic adjustment (GIA) and, as with many geological processes, it’s generally pretty slow. The Antarctic continent is actually still in the process of ‘bouncing back’ with the release of the burden of the ice sheets of the last ice age, which were at their biggest 21 500 years ago. Back then, parts of the Antarctic ice sheet were 300–400 metres thicker than today and exerted a much greater load upon the Antarctic continent. Because the GRACE gravity measurements are affected by the changes in mass caused by both the melting of ice and the movement of the underlying rock, calculations of ice melt need to take into account the ongoing process of glacial isostatic adjustment.
Using precise measurements of changes in gravity and an understanding of these ongoing processes, combined with GPS measurements that provide a check on how the bedrock is moving, Professor King and his colleagues refined the calculations of how much water Antarctica’s ice sheet is contributing to the ocean each year. They came to the figure of 69 billion tonnes per year—equivalent to around 190 million tonnes per day. In terms of sea level, it equates to an increase of around 0.2 millimetres per year over the period 2002 to 2010. More recent work with additional data spanning the period 1993 to 2014 has put that amount at 0.3 millimetres per year.
This may not sound like all that much, but when combined with all the other factors that affect sea level—melting of the Greenland ice sheet and mountain glaciers, thermal expansion of the oceans (as the oceans warm, they increase in volume), and the extraction of groundwater, which ultimately ends up in the ocean, today we’re looking at an overall rate of 3.3 millimetres per year. With more climate warming (which ice hates), the rate will increase over the coming decades and centuries. Even if we manage to halt the ongoing warming of the planet today, the ice will continue to melt at the current rate. This means we're looking at a minimum increase in sea level of 33 centimetres within a century. Thirty-three centimetres will have different impacts upon coastlines around the world. In areas where infrastructure is built up right along the current shoreline, 33 centimetres could well be devastating. The primary risk from higher sea level comes from the increased frequency and impact of extreme events, such as high tides and storm surges.
Professor King and his colleagues have made huge contributions to our knowledge of our planet’s ice sheets and how they’re affected by climate change. And his work doesn’t stop with the ice, it also looks at the response of the solid Earth and its role in the planet’s climate system. Examining the interplay of the past and current climate system with the rest of the planet is crucial for improving our understanding of the current climate system and informing predictions of what’s to come in the future.


