How we measure global sea-level changes
There are a few ways we directly measure sea level. One is tide gauge observations—simply measuring the height of a tide on a fixed marker. As the tide marker is attached to land, this provides a measurement of sea level relative to land. In some areas, the land might be rising (uplift) which would mean the local sea level would be falling faster than if there was no land motion. In other areas, the land might be subsiding, which would result in higher local sea-level rise.
Another method is satellite altimetry, where satellites measure the actual height of the ocean surface.
By combining these two methods, scientists can put together a picture of average global sea level changes.
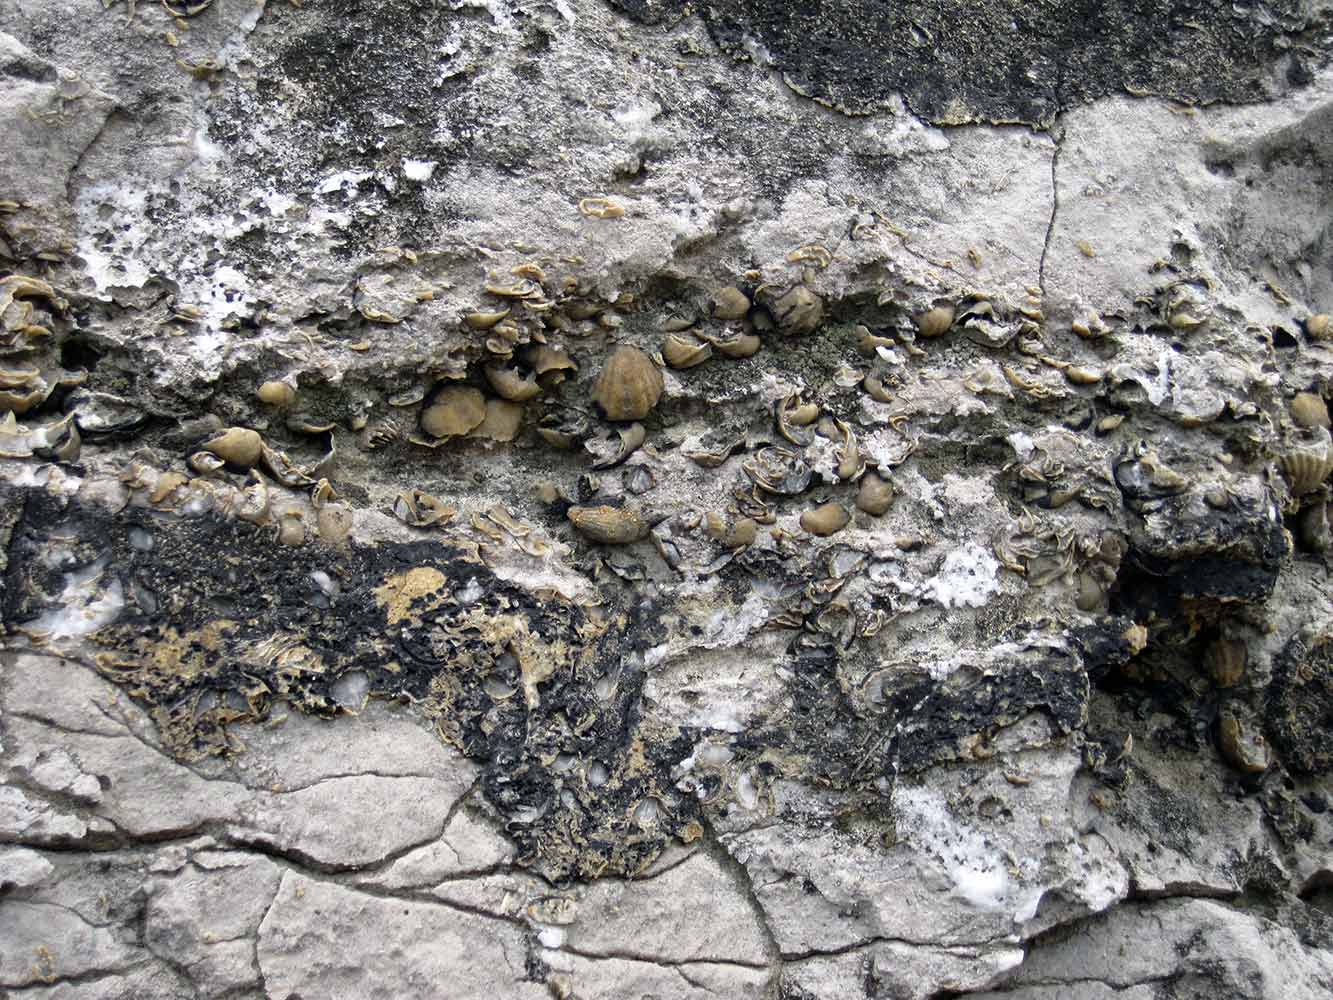
We can also look to the rock record. Rocks exposed on dry land today that have fossils of coral or fish in them must have been covered by an ocean in the past, which can tell us how sea levels have changed over longer time periods—changes that may have been caused either by uplift or subsidence or by global climate changes.

Right now, we know that sea level is rising. Combined tide-gauge and satellite altimetry data indicate that average global sea level rose by around 20 centimetres between 1880 and 2014. There was an increase in average global sea level of around 3 millimetres a year during the 20th century.
The ultimate driver of rising global sea level is increased global temperature. As heat from the atmosphere is transferred into the oceans, the water warms. As it warms, it expands, increasing the oceans’ volume and as a result they take up more space—and sea level rises. Increased temperatures also mean increased melting of land-based ice, such as glaciers and ice sheets. As they melt, more water enters the ocean—and sea level rises. A point to remember is that no extra water is added to the oceans when ice floating in the ocean melts. As floating ice melts, it only replaces the volume of water that it originally displaced.
How can we measure these different contributions?
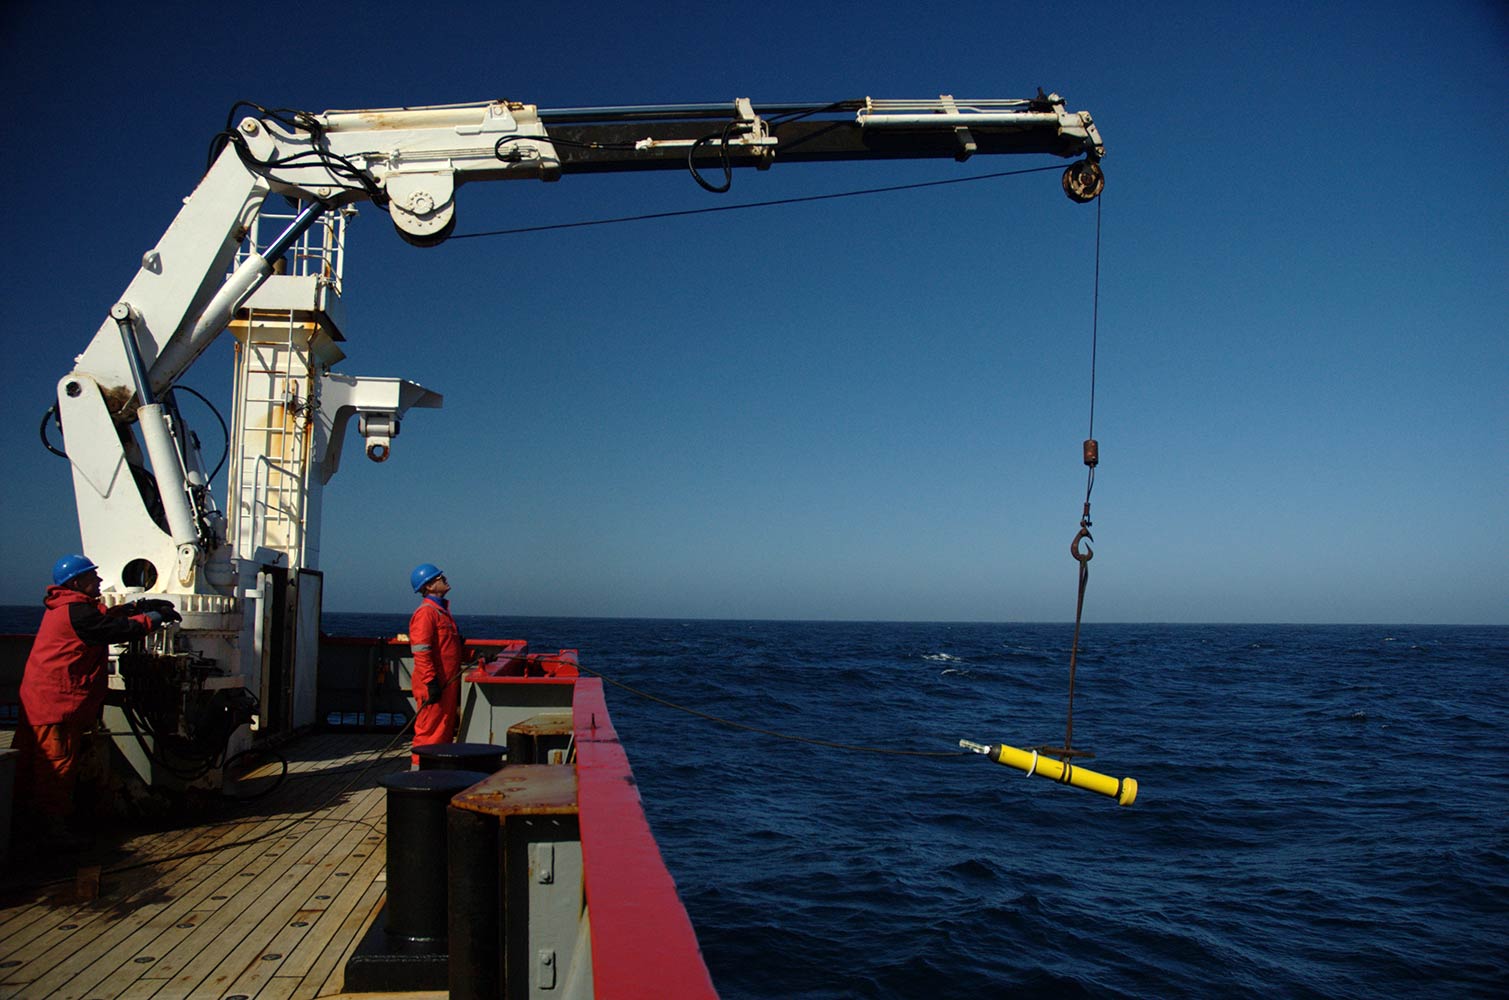
The thermal expansion contribution to sea-level rise is also known as the steric contribution. In the upper 1500 m of the ocean, the steric contribution to sea level rise can be calculated from ocean temperature measurements recorded by the ARGO array—3,890 free-drifting profiling floats that measure temperature and salinity in the upper 2000 m of the ocean. New ARGO sensors are now being deployed to measure below 2,000 m.

The change in the amount of water in the ocean can be calculated from measurements of the ocean’s mass, interpreted from the data collected by the satellites of the Gravity Recovery and Climate Experiment (GRACE) program. With its two satellites that orbit Earth, precisely measuring anomalies in Earth’s gravity field, GRACE is able to measure the changing mass of Earth’s surface or interior.
The gravitational pull of an object depends on its mass. With its mountains, oceans, deep trenches and different rock types, the composition and thickness of Earth’s crust are not the same all over, and this results in slight variations in Earth’s gravitational field. The small variations in Earth’s gravity cause ever-so-slight differences in the orbital speeds of the GRACE satellites as they circle the planet, one lagging the other by around 220 km. The two satellites use microwave pulses to measure how their relative speed changes, and this is then related to changes in Earth’s gravity. These data are combined with other information obtained by various sensors such as accelerometers and GPS on board the satellites, enabling scientists to calculate regional variations in Earth’s gravity, and therefore mass. By accumulating data over time, scientists can track changes in water bodies—the movement, accumulation or loss of water from particular regions on land or in the oceans.

Satellite altimetry provides a total measurement of sea-level rise, as the height of the ocean takes into account both thermal expansion and the addition of extra water from melting of glaciers and ice sheets. Comparing total altimetry data and GRACE mass data is another way to determine the steric contribution to total sea level rise.
So, which contributes the most to sea-level rise—melting ice or thermal expansion? Well, it depends on the time-scale you're interested in.
Since the 1970s, ocean thermal expansion has contributed around 40 per cent of the observed rise, with a similar amount from glaciers and ice sheets. Between 1993 and 2014, Greenland’s contribution increased from 5 per cent to 25 per cent of total sea-level change. The ice sheets stand to make a much more significant contribution in the future. Extraction of groundwater, which eventually ends up in the oceans after its use on land, also makes a small contribution, around 5 per cent.


