2017: the third warmest year on record
As we settle in to 2018, the data crunchers at the Australian Bureau of Meteorology have been busy looking back at 2017—its highs, its lows and what caused them.
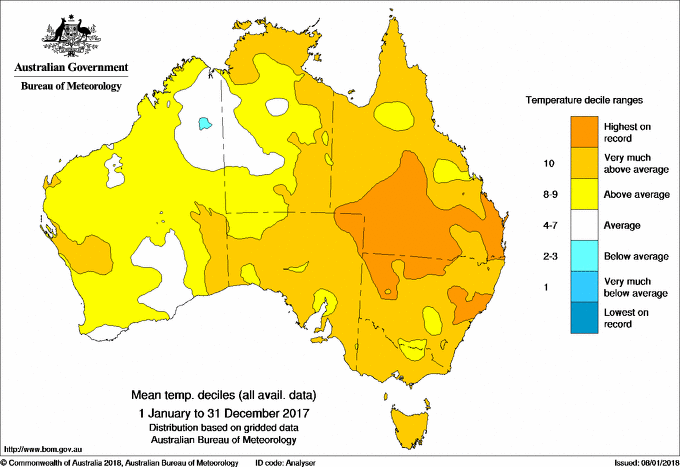
Overall, 2017 was another warm year for Australia. It takes out the bronze medal—it was Australia’s third warmest year on record, with a mean average temperature 0.95 °C above the average for the period 1961–1990. This 30-year period is used as a ‘baseline’ value against which we can compare other periods of climate data, 30 years being long enough to capture enough of the natural variation that occurs from year to year, but not so long that it’s influenced by long-term climate trends.
Most of the increased warmth of 2017 can be accounted for by increased daytime temperatures—average maximum daytime temperatures were 1.27 °C above the 1961–1990 average. These increases in average temperatures are consistent with the overall warming trend we’re seeing across the planet.
All states except Tasmania experienced hottest summer days of more than 40 °C—the monitoring station at Tarcoola Airport in South Australia took out the title for absolute hottest day of 2017, with a temperature of 48.2 °C. Coldest night goes to Perisher in the Snowy Mountains of New South Wales, with a temperature of -12.1 °C.

And it was warm in our oceans, as well. 2017 was the eighth warmest year on record with respect to sea surface temperatures. Particularly notable were prolonged high temperatures on the Great Barrier Reef throughout summer and autumn which saw widespread bleaching of the coral reefs, leading to the first recorded instance of mass bleaching events two years running.
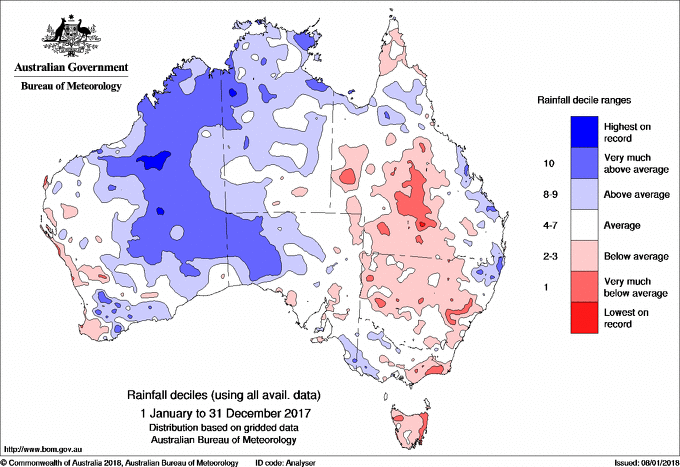
With regard to rainfall, overall 2017 was a slightly wetter year than average, but we had the second-driest June on record, and the Murray-Darling Basin—an important area for agricultural production—experienced its driest September on record. Tropical cyclone Debbie caused extensive wind damage and flooding in Queensland and northeastern New South Wales in late March and early April.

Influences on climate and weather
This very warm year occurred in the absence of El Niño conditions, a climate phenomenon that usually contributes to Australia’s hottest years. There are three climate phenomena that influence Australia’s climate weather conditions—ENSO (the El Niño Southern Oscillation, which switches between El Niño, La Niña, and neutral conditions), the Southern Annular Mode (SAM) and the Indian Ocean Dipole (IOD).
In broad strokes, El Niño conditions are caused by weaker winds across the Pacific Ocean, warmer water in the central and eastern Pacific along the coast of South America and cooler waters along the east coast of Australia. This results in generally drier and hotter conditions over the east of Australia. On the other hand, La Niña is typified by cooler waters in the eastern Pacific and warmer sea surface temperatures along the east Australian coast. We generally experience cooler temperatures on land in eastern Australia and increased rainfall over much of the continent.
The Indian Ocean Dipole relates to the difference in sea surface temperatures between the western and eastern Indian Ocean. A ‘positive’ IOD phase is when waters in the eastern Indian Ocean are cooler than average, with warmer waters in the west. A ‘negative’ IOD is the opposite: warmer waters in the eastern Indian Ocean, cooler waters in the western regions. These changes in ocean temperatures affect the winds that usually carry moisture over Australia, providing rainfall. During positive IOD phases, the easterly winds over the Indian Ocean are stronger, resulting in reduced convection near and over Australia. This leads to reduced rainfall over the continent. Again, a negative IOD phase has the opposite effect—stronger westerly winds across the ocean result in greater convection near Australia and increased rainfall.
When an El Niño event occurs at the same time as a positive IOD phase, their dry conditions are compounded. Higher than usual rainfall is generally seen if a negative IOD phase occurs simultaneously with a La Niña event.
The SAM relates to the strong westerly winds in the Antarctic region. Variation in the strength of these winds can affect rainfall patterns and storm activity in southern Australia. During a ‘positive’ SAM the westerlies contract towards Antarctica and are weaker closer to Australia. If this occurs during the spring and summer months, the southern parts of our continent receive more rainfall. However, a positive SAM will generally result in less rainfall if it occurs during the autumn and winter months.
While each of these events occur on various timescales, the prevailing conditions for 2017 were of a neutral ENSO for much of the year, with a weak La Niña seeing the year out. The SAM was positive throughout winter, bringing many cold frosty nights and lower than average winter rainfall. While there wasn’t a full-blown IOD event, the Indian Ocean close to Australia was cool, also making conditions unfavourable for winter rainfall over much of Australia.
And for the future? We’ve started off 2018 under the influence of a weak La Niña, which is not expected to have a dramatic effect upon prevailing weather conditions. As for the influence of ongoing climate change? Well, 7 of the 10 warmest years on record have occurred since 2005 and climate models indicate that this record-breaking trend will continue. The increased carbon dioxide (CO₂) already in the atmosphere has locked in a trajectory of increased warming until mid-century at least.
We’ll just have to wait and see if 2018 turns out to be another record-smasher.


