
Earth’s climate has changed dramatically many times since the planet was formed 4.5 billion years ago. These changes have been triggered by the changing configuration of continents and oceans, changes in the Sun’s intensity, variations in the orbit of Earth, and volcanic eruptions.
Natural variations in the concentrations of greenhouse gases in the atmosphere, the evolution of life and meteorite impacts have also caused climate change in the past. Several million years ago, for example, global average temperature was a few degrees higher than today and warm, tropical waters reached much farther from the equator, resulting in very different patterns of ocean and atmospheric circulation from today.
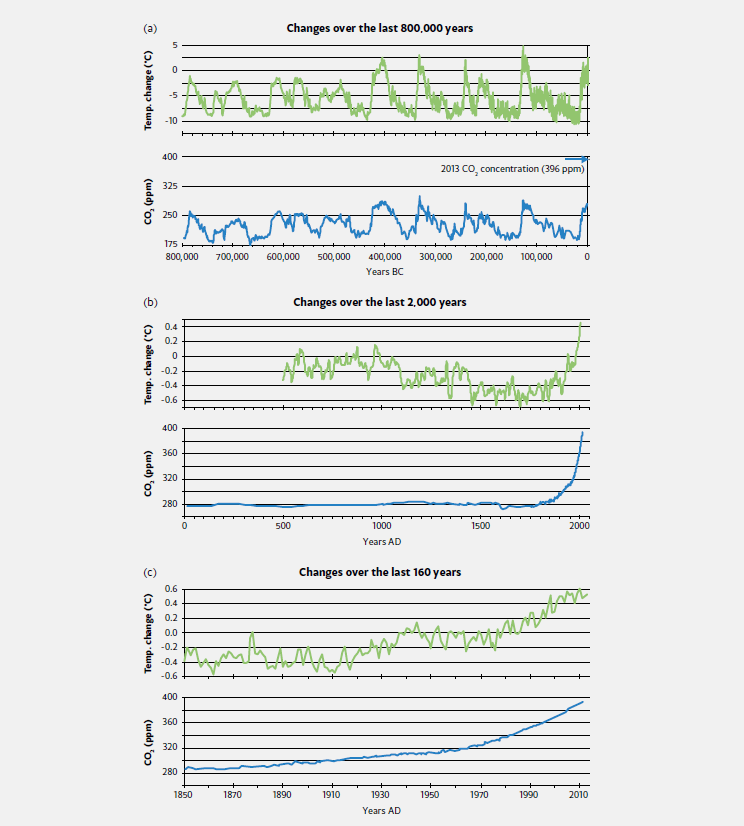
Over the past million years, Earth’s globally averaged surface temperature has risen and fallen by about 5˚C in ice-age cycles, roughly every 100,000 years or so (Figure 2.1a). In the coldest period of the last ice age, about 20,000 years ago, sea level was at least 120 metres lower than today because more water was locked up on land in polar ice sheets. The last 8,000 years, which includes most recorded human history, have been relatively stable at the warmer end of this temperature range. This stability enabled agriculture, permanent settlements and population growth.
Most past changes in global temperature occurred slowly, over tens of thousands or millions of years. However, there is also evidence that some abrupt changes occurred, at least at regional scales. For example, during the last ice age, temperatures in the North Atlantic region changed by 5°C or more over as little as a few decades, likely due to sudden collapses of Northern Hemisphere ice sheets or changes in ocean currents.


 by LandLearn NSW
Ice-age cycles were initiated by small variations in the rotation of Earth and in its orbit around the sun. These changed the seasonal and latitudinal distribution of solar energy reaching Earth’s surface. Measurements from climate archives such as ice cores (Box 2.1) show that changing temperatures triggered changes to other climate factors such as the concentration of carbon dioxide (CO2) in the atmosphere (Figure 2.1a), amplifying the initial disturbances. During warm periods, the major greenhouse gases CO2 and methane were released into the atmosphere, and receding ice sheets reflected less sunlight to space. These observations confirm that the climate system is sensitive to small disturbances that can be amplified by reinforcing feedback processes. Likewise, the climate system today is sensitive to disturbances from human influences.
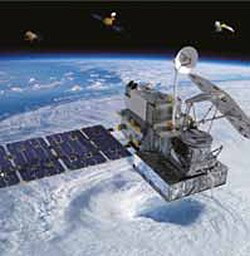
Identifying temperature change that is global in extent requires frequent observations from many locations around the world. Thermometers, rain gauges and other simple instruments have been used to measure climate variables, starting in the mid-19th century. Over time the quality, variety and quantity of observations has improved. Since the 1970s, sophisticated sensors on earth-orbiting satellites have provided near global coverage of many climate variables. By carefully analysing the data gathered using these techniques (with careful account for changes in instrument types, observational practices, instrument locations and urban areas) it has been possible to map the distribution of temperature and other climate changes since the late 19th century.
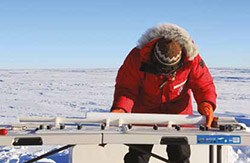
To study climate changes that occurred before direct measurements were made, scientists use indirect evidence from other sources that record a climate signal. These include climate signals encoded in the composition of ice cores, corals, sediments in oceans and lakes, and tree rings. All these records are laid down sequentially over time as an organism grows or as sediments accumulate. Ice cores from polar ice sheets, which are built from snow laid down over tens to hundreds of thousands of years, provide records of both past CO2 and temperature. As the snow transforms into ice, it traps air in sealed bubbles that provide a sample of past atmospheric composition, while the ratio of stable isotopes of either oxygen or hydrogen in the water molecule is related to the temperature at the time when the snow fell. More recent historical changes can be identified by analysing written and pictorial records, for example of changes in glacier extent.
According to most estimates, the rate of average surface warming has slowed since 2001, despite ongoing rises in greenhouse gases. This slowdown is consistent with known climate variability. Indeed, decades of little or no temperature trend can be seen throughout the last century, superimposed on the long-term warming trend.
Two main factors have contributed to the most recent period of slowed surface warming. First, decadal variability in the ocean-atmosphere system has redistributed heat in the ocean, especially in the eastern and central Pacific. This has caused warming at depth and cooling of surface waters and the lower atmosphere in this region. Second, several temporary global cooling influences have come into play including unusually weak solar activity (Box 3.1), increased aerosol production, and volcanic activity.
None of these influences is likely to continue over the long term. Moreover, despite the slowdown in warming at the surface, there have been continuing increases in heat extremes and in the heat content of the oceans, as well as rising sea levels, shrinking Arctic sea-ice, and ongoing melt of ice sheets and glaciers. Some models predict that, when the current slowdown ends, renewed warming will be rapid.

 by NASA/Lora Koenig
Climate and sea level were relatively stable over thousands of years of recorded human history up to the 19th century, although with some variations (Figure 2.1b). However, globally averaged near-surface air temperature rose by around 0.8°C between 1850 and 2012 (Figure 2.1c). The rate of warming increased in the mid-1970s, and each of the most recent three decades has been warmer than all preceding decades since 1850. The last decade has been the warmest of these. Satellite observations and direct measurements also show warming in the lower atmosphere over the past three decades. In contrast, the atmosphere above about 15 km elevation (the stratosphere) has cooled over this time.
The temperature of the oceans has also risen. More than 90% of the total heat accumulated in the climate system between 1971 and 2010 has been stored in the oceans. The greatest ocean warming has taken place close to the surface, with the upper 75 m of the ocean warming by an average of 0.11°C each decade between 1971 and 2010.
Changes consistent with an increase in global temperature have been observed in many other components of the climate system.
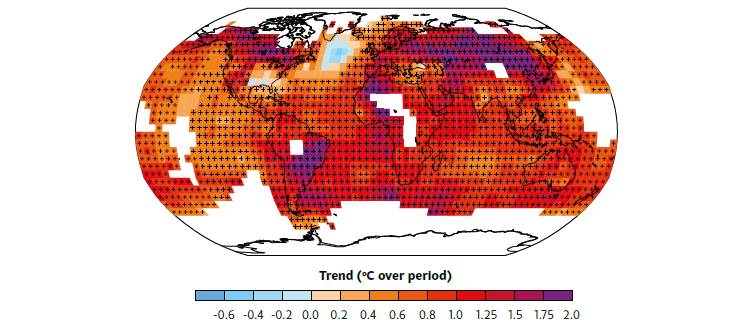
Over the past 100 years, temperature has increased over almost the entire globe; the rate of increase has been largest in continental interiors (Figure 2.2). The average surface temperatures over the Australian continent and its surrounding oceans have increased by nearly 1°C since the beginning of the 20th century (Figure 2.3). Seven of the ten warmest years on record in Australia have occurred since 2002. However there are differences across Australia with some regions having warmed faster and others showing relatively little warming (Figure 2.3 right).
Since the mid 1990s there have been significant increases in wet season rainfall over northwest Australia (Figure 2.4 left), a declining trend in southwest Australia, and a 15% decline in late autumn and early winter rainfall in the southeast (Figure 2.4 right).


© 2025 Australian Academy of Science