


Committee—Lloyd Rees Lecture

Purpose: To advise Council on the award of the Award, in accordance with Standing Order XXII.
- Professor Peter Hannaford AC FAA - Chair
- Professor Stjepan Marcelja FAA - Member
- Professor Franz Grieser FAA - Member
- Professor Debra Bernhardt FAA - Member
- Professor Dmitri Golberg FAA - Member
Committee—David Vaux Research Integrity Fellowship Award
Purpose: To advise Council on the award of the Award, in accordance with Standing Order XXII.
- Professor Simon Gandevia FAA FAHMS - Chair
- Professor Anne Kelso AO FAA FAHMS - Member
- Dr Daniel Barr - Member
- Professor John Finlay-Jones - Member
- Professor Keith Nugent FAA - Member
International Geological Congress travel grant scheme

Award highlights
- Specific funding is available to provide Australian and New Zealand geoscientists in the early stages of their careers with opportunities to travel internationally to further their careers as geoscientists.
- An initiative of the Australian Geoscience Council and the Australian Academy of Science.
An initiative of the Australian Geoscience Council and the Australian Academy of Science.
Specific funding is available to provide Australian and New Zealand geoscientists in the early stages of their careers with opportunities to travel internationally to further their careers as geoscientists by, for example, undertaking field work in appropriate areas, visiting and working with appropriate international experts, inspecting appropriate mines or other geoscientific features such as type localities, contributing to, as distinct from passively attending, professionally-organised geoscientific conferences or conventions, etc. Some history of volunteer contributions to the AGC or its member organisations will be viewed positively by the selection panel. This grant is not for domestic travel.
Key dates
Below are the key dates for the nomination process. While we aim to keep to this schedule, some dates may change depending on circumstances.
GUIDELINES
The following guidelines provide important information about eligibility, submission requirements, and assessment processes. Please review them carefully before submitting a nomination.
The Scheme is open to practicing geoscientists resident in Australia or New Zealand who hold a degree in geoscience (or equivalent). Those eligible to receive grants under the Scheme should generally be no older than 35 years, or within 10 years of receiving a PhD or commencing industry/government employment. Career interruptions, for example parental leave, will be taken into account. In order to demonstrate a commitment to the geoscience discipline and to reinforce the credentials of the applicant, applicants are required to have been a member of a geoscience society affiliated with the Australian Geoscience Council for at least 12 months.
Value
The anticipated value of each grant will be up to $5,000 and is intended to cover all or part of the cost of the proposed travel (including travel expenses, conference registration, and related meals and accommodation).
Location
The travel destination is not critical, but should be one of recognised value for developing the applicant’s career in geoscience and one where the participant’s personal safety will not be at risk.
Click the Apply button on this page to be taken to the AGC website and the application form. Successful applicants will be notified prior to the end of the year following the September deadline. Applications with special circumstances may be considered at other times. Due to the limited funds available, not all applications can be approved. Preference will be given to those adding the most professional development value to their trip e.g. by presenting papers, giving talks to local Geoscience technical gatherings, engaging with local researchers to expand your research, field trips etc. The selection panel may approve the full amount sought by an applicant, or may negotiate with the candidate to award a lesser amount.
Queries should be addressed to secretary@agc.org.au.
When the round is open, click the Apply button on the top right of this web page to be taken to the AGC website and the application form.
PAST RECIPIENTS
Read about previously awarded Travel Grants on the AGC website.
Shine Dome opening ceremony
6 May 1959
Sir John Eccles
Your Excellency, Excellencies, Mr Deputy Prime Minister, Members of the Government, Your Grace, My Lord Bishop, ladies and gentlemen. I welcome you to our home. We are assembled on a great occasion in the life of the Australian Academy of Science. His Excellency, Sir William Slim, has graciously consented to be present and formally to declare this building open. As yet, the Academy is very young. It is just over five years since Her Majesty, Queen Elizabeth, presented her Charter in person to the Provisional Council of the Academy at Government House in Canberra and already, as if by the magic that recalls to us the Arabian Nights, this fine home of the Academy has arisen in its perfection of form and is to be opened complete in every detail. Tomorrow it will be used for the first time for an official function, the fifth Annual General Meeting of the Academy.
But it is not for me to tell you about the building. This task I leave to Sir Mark Oliphant and it is appropriate that I do so for two reasons - as the first President of the Academy and the Chairman of the Building Committee he has played an all important role in every step that has led to the ceremony of today. My other reason is in a lighter vein. The public is very ready to believe that nuclear physicists are magicians and this building does look like a home for magicians, not only in the amazing way it has grown but also in its unique style. My task, as a biological scientist is to tell you something of the life history of the Academy, our conception, birth and growth and also what we do and how we hope to develop in the future. As with all industrially advanced countries Australia is increasingly dependent on science and technology for the development of her natural resources, for the efficiency of her industries, for the well-being and protection of her people. Only by the continued effort to use to the full the intellectual and technical potentialities of her people can any country achieve and maintain a place in the forefront of civilisation in this most progressive of centuries. Material resources in themselves are of secondary importance, as is witnessed by the amazing performance of countries such as Denmark and Holland. Within limits material deficiencies may even contribute to the scientific and technological advancement of a country for deficiencies provide an especial challenge. In Australia we have several such challenges – the widespread aridity, the oil impoverishment, the trace metal deficiencies in our soil.
The need for a national scientific body of the highest standing led in 1919 to the formation of the Australian National Research Council and thanks to the devoted efforts of its leaders the ANRC gave most valuable service to Australia, yet it would be generally agreed that it had failed to achieve the status that was required of a national body with such weighty responsibilities. Various efforts and internal reforms of the ANRC proved to be impracticable and a more radical proposal emerged from a Conference on Science in Australia, organised by the Australian National University in 1951. At this Conference and in the subsequent discussions, there was fairly general agreement that an Academy of Science, with much more restricted membership, should replace the ANRC. Eventually the Fellows of the Royal Society of London, resident in Australia, took the initiative in forming the Australian Academy of Science by adding to their number other Australian scientists of equivalent status, then petitioning for a Royal Charter and securing a larger income via Government Grant. Meanwhile the ANRC Executive, with great magnanimity, agreed to its dissolution in order to make way for the new Academy.
This was a fine act of self-sacrifice made in the belief that the new Academy would be better fitted to give leadership in the scientific development of Australia. A memorable Valedictory Dinner of the ANRC was held in Melbourne in 1955 and to give some idea of the goodwill I cannot do better than quote from Professor Cherry’s speech. ‘It is indeed an unparalleled occasion which demands a Miltonic illustration from history and from legend. One thinks, for instance, of the Arabian Phoenix, building with loving care that pile of branches which is to be both its nest and its funeral pyre. For it is to be consumed by fire and it is from the ashes that there arises its young and glorious successor.’ But that analogy is not quite right. The Research Council is to have its consummation not by fire but by dissolution and for solvent there has been chosen a liquid more potent than water – alcohol. Professor Cherry went on to say ‘The essential thing is that we shall succeed if we do such things as earn us the continuing confidence and support of Australian scientists at large. As to that we are resolved to be a working body. We shall succeed if we work with the same devotion, disinterestedness, order and good sense as I have observed from the sidelines for the past twenty years in the ANRC with its Chairmen, McCallum, Ward and Elkin’. Well now, that is the end of Professor Cherry’s remarks on that occasion.
The new Academy chose to model itself closely on the Royal Society of London, so taking advantage of three centuries of wisdom. The Academy is also especially indebted to the Royal Society for help in its petitioning for the Royal Charter and for the gift of a magnificent Signature Book that is a replica of the original Signature Book of the Royal Society and today they have sent as their official Representative, Sir Lindor Brown, the Senior Vice-President and Biological Secretary. We take great pleasure in regarding the Academy as a daughter institution. From the very beginning it has been of prime importance to ensure that the highest standards were maintained in the election to the Fellowship and that it was truly representative of all aspects of pure and applied science. It could be claimed that it has retained the confidence of the general body of scientists in Australia. In another personal way, it has succeeded better than we dared to hope. As a national body with membership drawn from the Universities, the CSIRO and other research institutions it has been instrumental in eliminating the jealous rivalry that had grown up between the Universities and the CSIRO. The affiliation of scientists is not even thought of in electing them to Fellowships or choosing them for positions of responsibility in the Academy. We are concerned solely with the advancement of science in Australia and in the world generally, or to express it more tersely, our concern is with science not with scientists as such. As will be seen in our Year Books, the functions of the Academy are both national and international. At the national level we have certain general responsibilities in the fostering of science and in its publication. I should mention here the biennial Matthew Flinders Lecture, which is the first lecture to be endowed by the Academy. We have organised a Symposium and issued a report on the grave problem of the shortage of scientific manpower and have also provided a special report on science in Universities for the Murray Committee. In part the implementation of the Murray Committee report will alleviate the manpower situation but several important problems remain unsolved and in the national interest the Academy will press for further action. At the national level our special responsibilities are very diverse, like in instance the Koszciusko catchment area, hydrology, tropical climatology, oceanography – nothing seems too large or too localised for we have recently acted in defence of the elephant seals in Macquarie Island.
However, it is at the international level that the Academy has its principal opportunities and functions. Firstly, it is the body representing Australia at all the International Scientific Unions as well as the Pacific Science Congress and the Pan Indian Ocean Congress. Secondly, it undertakes international scientific tasks for Australia. The most notable has been the International Geophysical Year, the Academy being responsible for Australia’s fine contribution. From the I.G.Y. there have developed further important international activities in which again the Academy represents Australia. The Special Committee for Antarctic Research and the Committee for Space Research are of vital interest to Australia and we have achieved a high status in both. The third meeting of the SCAR was held in Canberra this year and was generally agreed to be very successful. Amongst other achievements was the inauguration of the International Antarctic Analysis Centre as an annexe to the Bureau of Meteorology in Melbourne. Other international activities are the organisation of specialist international scientific meetings in Australia. In August a specialist biochemical meeting on Haematin Enzymes will be held in this building. It is a field in which Australia holds a high place and many of the leaders in other countries will come to Australia for the conference. Next year the Academy is arranging for an international conference on the Chemistry of Natural Products that will be held in Melbourne, Sydney and Canberra. These meetings are of great value in putting Australia on the scientific map and exhibiting our very considerable achievements in various fields of science. In all these national and international activities the Academy can count on the devoted service, not only of its own Fellowship, but of other scientists of Australia as well. Our aim is to select the scientists best fitted for these special purposes regardless of their affiliation with the Academy. On the Standing and National Committees of the Academy the Fellows are outnumbered and often scientists, who are not Fellows, hold key positions, for example, the success of Australia’s contribution to the International Geophysical Year has been in large measure due to the Convenor of the National Committee, Professor Hugh Webster. The scientists of Australia regard it as a real honour to be selected as members of our various Committees.
Let us look now into the future. Where do we go from here? I can assure you that there will be no relaxation of our labours now that we have a centre for science in Australia. This centre has fine symbolism with its geometrical form and its great restraint of line and décor. You can well imagine how much it will contribute to the atmosphere of many national and international conferences that will be held here in the forthcoming years. From here the Academy can radiate its influence over Australia and the world and receive from the world for Australia. But every end is a new beginning and the Academy is now planning to become, as well, a channel for benefactions for scientific purposes and so to exert our influence, not only through expert committees, and individually by our Fellows, but also by providing the finance for research projects. Benefactors would be secure in the knowledge that their contributions were being administered by the collective scientific wisdom of the Academy, rather than by the authority of any one scientist, however eminent. So the Academy goes forward into the future like some great caravan of exploration and discovery, always being joined by new recruits, always enlisting the help of other scientists best fitted for any particular project so that we can continue to command the cooperative effort of the scientists of Australia.
I now have much pleasure in calling on Sir Mark Oliphant, the Chairman of the Building Committee. Sir Mark Oliphant.
Sir Mark Oliphant
Mr President, Your Excellency, Mr Deputy Prime Minister and members of Government, Excellencies, Your Grace my Lord Bishop, ladies and gentlemen. An Academy without a home is like a family without a home. Thanks to the National University the Academy has been provided with an office, first in the Research School of Physical Sciences and then in the John Curtin School of Medical Research. However, the first Council and Officers realised very clearly that one of their principal aims must be to find a Headquarters which was not within the National University or any other organisation, if the Academy was to maintain its independence and be able to follow only its chosen path, as set out in its Charter – the advancement of natural knowledge. The first Treasurer, Dr Hedley Marston, and Mr W S Robinson, our Senior Fellow, were the prime movers in the search for funds with which to establish a national headquarters for science in this Federal capital. Their success in persuading some great enterprises that they should support the basic science upon which all industrial advancements rested encouraged others. Mr Essington Lewis, as would be expected of the father of BHP as we know it, added his weight to the appeal. His Excellency, unknowingly, played his part by enabling me to meet Lord Stratharnan at Government House, thereby assuring the support of the oil industry.
When a substantial sum had been received from our generous donors, even though it fell far short of what was required, Council took the bold step of authorising the Building Committee to negotiate for a site and to commission an architect. This fine site was made available by the Department of the Interior. The revolutionary concept of Mr Roy Grounds of Grounds Romberg and Boyd was chosen as most in keeping with the nature and objectives of the Academy of Science. Mr Grounds devoted himself to the task with enormous enthusiasm and imaginative insight and we were able to approve his plans and to let a contract in January 1958. The technical story of the design and erection of the domed building has been told in the booklet which has been distributed. Examples of plans and working drawings have been arranged by Mr Grounds as a display in the gallery on the first floor which you are invited to inspect. You need only to look around you to appreciate how successful this pioneering enterprise has been. My task today is to say how grateful we are to Mr Grounds and his partners and consultants for the inspired design and painstaking supervision throughout. To express our deep admiration for the skilled organisation of the builders, Civil and Civic Contractors Ltd., their Managing Director, Mr Dusseldorf and his assistants. To say how much we appreciate the magnificent craftsmanship of the Canberra tradesmen who did the actual building so rapidly and so well. To thank Mrs Grounds and Mr F Ward for the distinctive furniture and furnishings which grace this chamber and other rooms and to say how grateful we are to Professor Pryor and to the Department of the Interior for the layout, construction and planting of the surrounding grounds and roads. Above all, I have to offer our warmest thanks to the many generous benefactors who have subscribed to date over one half of the cost of this building. To the Prime Minister, Mr Menzies, who has encouraged and helped the Academy from its birth and to his Government which has adopted us as responsible and even respectable national institution which merits the continuing support of Australia, its industry and its commerce. Finally, I must thank our Assistant Secretary, Mr Deeble, upon whom much of the burden of administration has fallen and all others who have contributed in many ways to the successful completion of a chamber and offices of which we are justly proud.
The Academy of Science now possesses a home and its existence is apparent to all who come to Canberra. It is our pleasure to provide offices and the use of the chamber and its reception rooms for the Humanities Research Council and the Social Sciences Research Council. These sister organisations share many of the aims of the Academy and it is fitting that they shall share in the future, our roof and to leaven with humanity our approach to the problems which confront men of science in this technological age. We hope too, that other bodies of serious aim will use this building, which we believe will become a national asset of increasing value and importance to a developing Australia.
Sir John Eccles
I now have much pleasure in inviting His Excellency to address you and formally to declare this building open.
His Excellency – Field Marshall Sir William Slim
Governor General
Mr President, Mr Acting Prime Minister, Your Excellencies, ladies and gentlemen.
I am delighted to be able to tell you that yesterday I received a message from the Queen with her command that I should convey it to you. Before I address you I will read that message from her Majesty; this is the message – “ Please convey my good wishes to all assembled at the opening of the Australian Academy of Science Building on Wednesday. I am confident that the Academy, to which I presented its Charter five years ago, will play a significant part in the acquisition of scientific knowledge and in applying it to the progress and welfare of my subjects in the Commonwealth of Australia – Elizabeth R”.
The President of the Academy, Sir John Eccles, has handed me a reply which I shall be delighted to convey to Her Majesty – “We are honoured and deeply grateful for Your Majesty’s gracious message. We have been inspired by the confidence you have expressed, both when you presented the Charter five years ago and now on the occasion on the opening of our building. We will ever strive to be worthy of your confidence in our efforts to benefit our country and your subjects”.
Mr President, ladies and gentlemen. There is no country anywhere to which science is more important than to Australia. No longer does the Australian march out with his axe on his shoulder to hack out a homestead from the wilderness, yet we are still a pioneering people, still marching out to wrest a better life from our land. But the time has passed for the old pioneering methods of trial and error. We can’t succeed unless we adopt the methods of the new pioneering, the blending of practical experience with the discoveries of science. If I press down a switch here a light will flood on from above, but that’s not merely because I pressed a switch but because over the years a thousand men have each contributed their part to make the light shine. Many of those shares were important, some vital, all necessary to the achievement, but there was one contribution, without which none of the rest would even have been thought of, the original basic discovery on which all that follows is based and that was the work of a scientist - some scientist engaged in research. Without such research none of the modern inventions or amenities that we enjoy would have been possible. Nor, without the continuance of that research will any others in future. It’s sad, therefore, that the amount of research done in Australia is still, on a comparative scale with other advanced countries, small. True, research is awfully expensive and it may not show quick results but in fact there is no investment that will pay so large a dividend in material benefit as money wisely spent on scientific research and we are extremely fortunate in this country that we have so many leaders in our industry and other walks of life who are wise enough to recognise that and public-spirited enough to act upon it. By fostering, planning, guiding and organising this research in Australia this Academy is already and will increasingly make itself, one of the most vital and valuable of our national organisations.
Obviously, if we are to increase the amount of research, both basic and applied that is to be done in the country we shall have to get more scientists. Our own Australian scientists have won world recognition and we now, more and more, attract distinguished scientists from other countries, yet scientific progress here will depend almost entirely on our own recruitment in Australia. As an outside observer, I am not sure we are going the best way to enlist and train our recruit scientists. In science it’s quality rather than quantity that counts, especially if we are to build up in this country a great potential of science. It’s not the number of science students that we have but how many capable and qualified scientists we produce. At the moment we cram our Science Faculties until they burst at the seams, well knowing that a dismaying percentage of the students will never stay the course and then having done that we moan about the lack of accommodation. It seems to me that possibly a quicker way to get the scientists we want, to improve scientific education and at the same time to save a vast waste of time, money and teaching capacity would be to eliminate unsuitable students before entry. With surely the application of a little of the scientific method to the study of this problem we should hope to separate the undoubted goats from the potential sheep.
There are two factors which affect the progress of science and its application in almost all countries, but most severely, I think, here in Australia. At its very beginnings science is hampered by the dearth of science teachers in our secondary schools. It’s indeed in this respect, more I think than in any other that we need more scientists. Strangely enough too, we seem to make singularly little use of women in this field. As to the second factor, our lack of scientists has been widely and ably advertised. The scientist is undoubtedly the key man, the man who starts the snowball rolling but more and more, if it is to be kept rolling, gathering in speed and size we need scientific engineers and highly skilled technicians who can transform the laboratory processes of the research scientist into the practical commercial methods of industry and agriculture. I would suspect myself that their lack, the lack of these engineers and technicians is a greater drag on our progress than any shortage of actual scientists. But none of these handicaps need be more than temporary. They are not too difficult to overcome if we have the will and even with them Australia today presents an unequalled field for the progress and application of science; the continent whose resources are as yet hardly tapped, holding out such rewarding challenges as should stimulate us all.
One of these challenges is now fairly flung down in front of us. Is it too much to hope that in the immediate future there will be found among us men of boldness and imagination enough to take a leap from coal and oil to atomic power and thus place Australia far ahead in the new age. Very soon we must begin in this country, if we are to maintain our position, very soon to train the hard and practical way not only our scientists but above all our atomic engineers and technicians. Scientists today have placed in our hands power over nature, fantastically beyond any ever before used by man. Whether this is good or evil for mankind remains to be seen for the final and paramount importance of power is not how much we have but how we use it. In this the science itself cannot guide us, nor can the scientist as scientist, any more than can the man who has sold us a motor car tell us to what destination we should drive or what we should do when we get there. Science deals with material things and of necessity, and rightly, gives factual and material answers to its problems. When it comes to deciding what use we make of the power science has given us then other issues than material ones arise, first political and finally moral ones. For half a century, as the best scientific minds of our age have probed the minutest detail of matter, explored the vastest realms of space, as the frontiers of power have been pushed forward and as the horizons of knowledge have receded we have discovered that science is no longer, as it once threatened to be, at war with the things of the spirit. Knowledge and faith can support one another. The mind and soul of man can be in unity. Here in Australia, which in essence is still a pioneering land, it is vitally important that as greater and greater material powers are granted to us we should grow more and more morally fit to use them. There must be parallel advance on both fronts, but today we are concerned with the advance on one front, the scientific front and all the immense importance that means to every single soul who lives in this country. One of the most important things of that is how it should be coordinated and directed. In this Academy of Science we have a body of men who are not only qualified in knowledge, but capable with a wider wisdom to watch over that advance and here is that very important part of any command organisation, its headquarters building. In this building the oldest of the arts, architecture, has come to the service of the newest of the sciences in a happy combination of utility, originality and with a beauty that adorns our Capital and blends with our lovely countryside. It is with the greatest pleasure I now declare this building open.
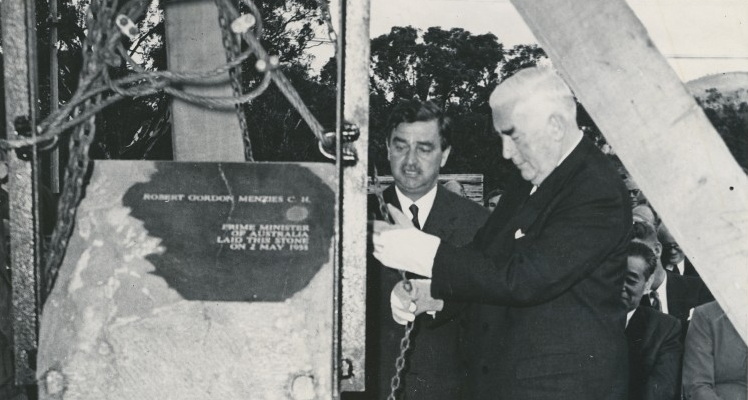
The laying of the foundation stone:
2 May 1958
Professor John Eccles
The Right Honourable the Prime Minister, Your Excellencies, ladies and gentlemen. It is my pleasant task this afternoon to preside on the occasion of the laying of the foundation stone of the Academy building. I would specially like to welcome our distinguished representatives on the platform, the Prime Minister, Mr Makin representing the leader of the Opposition, Professor Gaddum officially representing the Royal Society of London.
I am going to speak briefly on the Academy itself. It is remarkable that the whole history of the Academy has occurred in Canberra. In 1951 a meeting of leading scientists, technologists and industrialists was held in Canberra to discuss the future of science and technology in Australia. This conference clearly established that there was an urgent need for the establishment, at the highest level, of a national organisation of scientists. The Royal Society of London had long played this important role in Great Britain, having there a position of unquestioned authority in all matters pertaining to science and the applications of science. This conference served to enthuse some of the leading scientists of Australia, notably Professor Oliphant and Dr D F Martyn, with the idea of founding a national academy that would do for Australia what the Royal Society was doing for Great Britain. Fortunately there were resident in Australia 11 Fellows of the Royal Society of London and in order to make a sufficiently representative body these Fellows selected a further 13 scientists to help in the task of founding the Australian Academy of Science, as it was to be called. In July 1952 there was a memorable meeting with the Australian National Research Council here in Canberra and the Officers of this Council, under the Chairmanship of Professor Elkin, with great magnanimity, agreed to recommend to their members that the Australian National Research Council be dissolved in order to make way for the Australian Academy of Science, provided that the new Academy assumed responsibility for the various duties and functions of the ANRC. The stage was thus set for forming the Academy of Science and petitioning for a Royal Charter. A council of 10 was set up with Professor Oliphant as the first President.
In response to representation to the Prime Minister an annual grant of £10,000 was made to the Academy and the Prime Minister also facilitated the negotiation in respect of the Royal Charter, but the Academy will always be especially grateful for the historic occasion on February 16th 1954 when her Majesty, Queen Elizabeth II founded the Australian Academy of Science in a private ceremony attended by the President of the Academy and members of the Council. The historic character of this occasion will be appreciated when I inform you that this is the second occasion on which a reigning British Monarch has personally founded a scientific academy. The first occasion was almost 300 years earlier when Charles II founded the Royal Society of London.
After the founding ceremony the infant Academy set upon a vigorous policy of development in order to fit it for its self-appointed task of developing and applying science in Australia. Undoubtedly the first concern of the early Academy was to ensure its growth and development by election of Fellows having the highest level of scientific and technological attainment and also of Fellows who have rendered conspicuous service to science and the application of science. But already the Academy has an impressive record of achievement. Firstly, I would mention that it has caused the scientific community of Australia to know itself so that there is more friendly cooperation and understanding and less antipathy.
Secondly, I venture to think that the possibility of election to the Academy provides an incentive to young scientists. We are all human and I believe greatly in incentives at all levels.
Thirdly, the Academy has represented Australia internationally on many occasions. Our greatest task in this respect has been the International Geophysical Year where we have been entrusted with a major share of Australia’s efforts in a spectacular and worldwide project. During the last year we have also been responsible for Australia’s representation at the Pacific Science Congress and the Pan Indian Ocean Conference. At present we are making plans to have international conferences in Australia in specially appropriate fields. Thus Australia is rightfully taking its place at a high level in the fields of scientific endeavour.
Fourthly, the Academy has been vitally concerned in the application of science to many local problems of great practical value to Australia - scientific manpower, water resources, the Kosciusko Tops and erosion problem, man and animals in the tropics, oceanography and so on over a wide field of applied science. It has been responsible for meetings and symposia on these important problems, employing to the fullest extent experts in the various fields. Whether Fellows of the Academy or not they have given devoted service.
Well now, that is just an account of what the Academy stands for and what it has done and I now have great pleasure in calling upon Professor Oliphant to tell you something about the building. Professor Oliphant.
Professor Mark Oliphant
Mr President, Mr Prime Minister, Your Excellencies, ladies and gentlemen. An organisation, for whatever purpose it is created, must have a home. The Academy of Science, founded under such auspicious circumstances by her Majesty the Queen, has sought to provide itself with a home, a headquarters for science in Australia. A national home for a national activity as important in the future of this country as is science in Australia, might well be expected in these days to be provided by the Commonwealth Government. However it is well known that men of science are independent folk and often extremely cussed people and the feeling that the Academy should be as separate from the functions of government as possible was reinforced when those two outstanding figures in the development of Australia, Mr W S Robinson and Mr Essington Lewis, were elected to its Fellowship. Encouraged by our first Treasurer, Dr Hedley Marston, Mr W S Robinson was able to persuade (perhaps I should say blackmail) many leaders of industry into the recognition of the fact that they should support the claims of science for a national headquarters and very generous donations were received from the non-ferrous metal industries, from the oil companies and from the motor car manufacturers. Mr.Essington Lewis ensured that a notable contribution came from the steel industry.
Meanwhile Dr Marston and I had approached other industries and we found the same generous response from the paper manufacturers, the glass manufacturers, the trading banks and many others. We are very happy to have with us today representatives of several of our major benefactors. Recently we received our first donation from the primary industries of Australia which have probably benefited so much from the application of scientific knowledge to their many problems; indeed, benefited more perhaps than any other section of Australian industry. Australian Estates Pty Ltd, a Company with its headquarters in London, by the way, has made a donation of £1,000. We hope that further support will come from those primary industries which are the backbone of Australia. At the present time we have received a total of £115,000, towards a goal of £250,000.
Nevertheless, the Academy has had sufficient faith in the public appreciation of the outstanding significance of science in Australia to decide to go ahead with its building program. It has sought to provide a fitting, but modest headquarters which will symbolise the meaning of science and the spirit of the search for natural knowledge. In this task we have been aided enormously by the architect, who we were lucky enough, perhaps I should say wise enough, to choose to design the building. The Department of the Interior made available to us this magnificent site with its semi-circular frontage to the Institute of Anatomy and adjacent to the National University and to Canberra University College. Mr Roy Grounds, of Grounds, Romberg and Boyd, with remarkable insight into our needs and with the boldness of the true contemporary artist, has designed a building which we believe will prove to be one of the great creations of this period of architecture. The round conference room, which is behind those seated here, to seat about 250 persons under proper conditions for serious discussion of scientific and technical matters, is the core of this building. Offices and reception rooms are arranged around it under a dome of copper-clad shell concrete. The whole will be surrounded by a cloister and a decorative moat and the grounds will be suitably landscaped. The Academy has been fortunate too, to have as the contractors for its building so experienced, so well equipped and so skilful a firm as Civil and Civic Contractors Ltd. The work which they have done to date is good and we are sure that the completed building, which should be finished in about one year from now, will be a credit to the architects, the builders and we hope a very suitable home for science in Australia.
I call upon the Prime Minister, having laid the stone now to briefly address us. The Prime Minister.
Robert Menzies – Prime Minister
Sir, Mr Makin, Your Excellencies, and ladies and gentlemen. I was about to utter the mystic words “I declare this stone well and truly laid”, but come to think of it, I think it is a little bit off true. Anyhow, now doubt I am wrong and this is off true. I think perhaps I ought to tell you that I have been enriched with some information about this stone. This is like me, it comes from Melbourne and has been planted now here and it is one of the old piers of the Melbourne Observatory, dating back to 1870. I was very kindly forwarded with the history of it, which I read with immense pleasure, particularly when I discovered that at the time when they were discussing establishing an Observatory in Melbourne and this stone became one of the piers supporting it, the Committee in Melbourne, it’s to be admitted, recommended that the Observatory ought to be established in that City, not only because of its geographical position, but because of the clearness of the air; a quality about Melbourne that I have always asserted but which I find constantly denied by those people unfortunate enough to be born in other places. And here it is, a souvenir, a very impressive souvenir of that Observatory in Melbourne, the old Observatory, the foundations of which run back really to the initial discussions in about 1852 and I like that, sir, if I may say so, because it’s a very good thing, indeed it’s one of the things aimed at by this Academy, that we should not fall into the error of thinking that science began this morning. We’re a little bit tempted to think that way in many aspects of life, you know ‘Here today, gone tomorrow. Everything that we know is quite new, everything that was known before was irrelevant’. It’s a very good thing to be reminded occasionally that we’re not only the creators of some things, but we’re the inheritors of a great number more and therefore there is a tradition in science, there is a body of knowledge in science of which these distinguished men who belong to the Australian Academy are at once the inheritors and the expositors and to which they themselves undoubtedly are adding material volumes of knowledge.
And so continuity, as in many other things, indeed as in all other things, is of the essence and therefore, sir, I rather like the idea that this stone, simply inscribed then placed in that form, is something that serves as a nexus between this most modern of buildings, as it will be in an older day when buildings of this kind were perhaps never thought of.
One other thing, or perhaps two other things, I would like to say because I don’t want to make a long speech to you. I am very proud of having had some association with the formation of this Academy. It’s quite true that on each occasion of the two on which I was brought into it I was the victim of the persuasive faculties of Professor Eccles and the downright capacity for, well, what shall I say, of Professor Oliphant. They came to see me in the first place, they expounded their views about an Academy of Science and we had a very fascinating and, of course, highly intellectual discussion about it and then I gave them some advice, very good advice I thought, anyhow, in a broad way they acted on it, I waited, waited for the blow to strike. You know, waited for Oliphant to say ‘That will cost you so many thousand pounds’ but with the skill that he is rapidly acquiring in this city, he said nothing that day. That was indoctrination day. That was ‘getting me interested’ day and then of course, the moment I committed myself to say ‘Well, now look, I don’t mind giving you some advice as to how about getting a Royal Charter and all that kind of thing and a few notions about the rules that have to be observed’. It was only the next morning when I woke up and looked back and knew that I was lost. And, of course, it was quite right because a fortnight later Oliphant, with the most ingratiating style, came along to me and in the homely phrase ‘Nipped me’ and then ever since then I have remained ‘nipped’, but very proud I am to have been nipped because I think that the day will come when in Australia those who were associated, and there are some very famous men have been referred to here this afternoon, those who have been associated with the establishment of this Academy will be greatly envied by those who, at that time, will realise what great work this body has done.
Its task is not easy – perhaps you will allow me to add this before I conclude – its task is not easy, it must be completely selective in its membership because it’s of the essence that its standards should be high. There was never a time when high standards were more needed than in a world in which, as has been truly said, there is the constant danger of the mass mentality created by mass means, either of instruction or of entertainment and therefore the standards must be high, they must be selective and yet at the same time they are not to be narrow, they are not to be conservative, they are not to exclude from consideration people who have something good to do for the future of science. We are all tempted when we get to my age to become a little defensive about our own ideas about our own particular knowledge, about our own particular skills, whatever they may be. That is to be guarded against because if there’s one thing that shines out in the history of this century it is the enormous capacity of science to expand its boundaries. The degree to which matters of the greatest complexity have been evolved and built on in our own lifetime is not only fascinating, but positively bewildering and he would be a very dull soul, I think, who didn’t realise that by the end of this century, when most of us will not be here as first-hand witnesses, but will have, I trust, a good view from on high, by the end of this century it is quite clear that the boundaries of knowledge to the activities of scientists will have been pushed back to places as yet unseen and unimagined and in all that in our own country this Academy, established by the finest body of scientists this country has ever had, adding as it will in the future to its own numbers men of corresponding faculty, men and women of corresponding gifts and enthusiasm, is going to make a contribution to the body of scientific knowledge in the world, which won’t be just confined to Canberra, but will extend over the world. Indeed, sir, let us all remember, as temporary or permanent residents of this small city, that there is a temptation in Australia to think of Canberra as something remote, as something detached, as something unaffected by the pulse of the life of the nation. The more we do of this kind, the more will that fallacy disappear, the more will it be understood that this is not merely the Capital of Australia by Act of Parliament, but is the centre of Australia in many of the great intellectual activities in which the people of Australia will have to engage.
Sir, I declare the stone well and truly laid.
Professor John Eccles
I think we have all listened to a most remarkable and memorable speech by our Prime Minster, for which, on behalf of the Academy, I thank him very much. I also thank him for officiating on this ceremonial occasion on a stone which has had a long history and which is at last, we hope, permanently resting here as an historic exhibit of the early days of Australia, bringing, as he said, memories of the past up to the present. I now declare this occasion at an end. Thank you very much.
History of the Shine Dome
The story of its construction
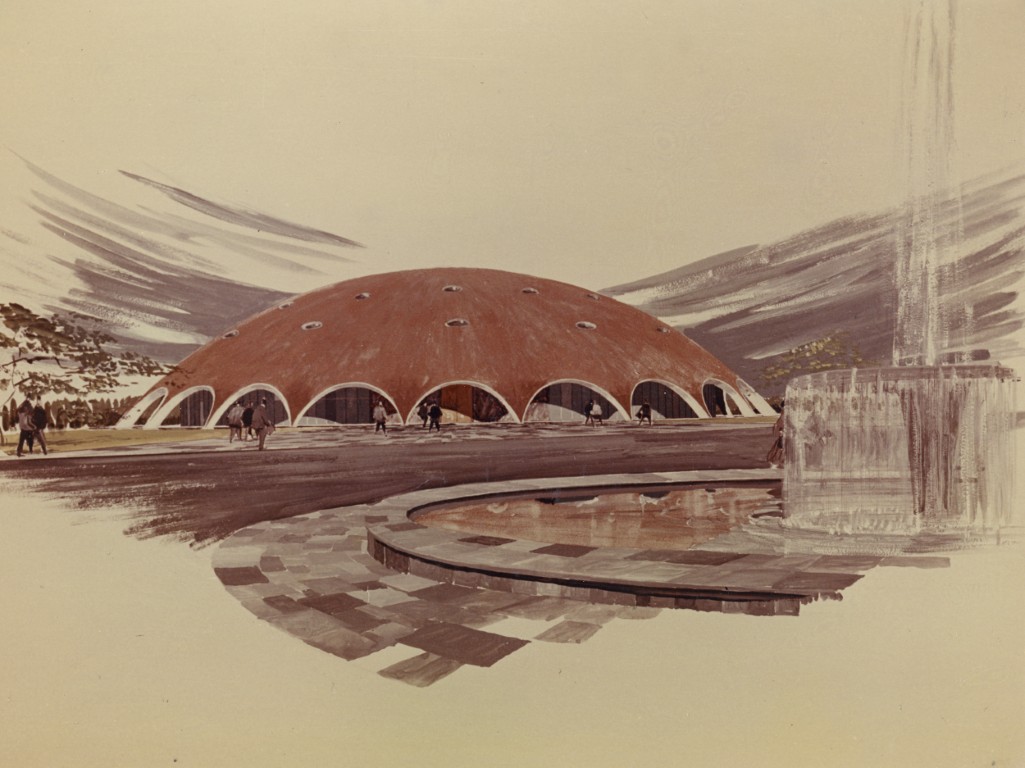
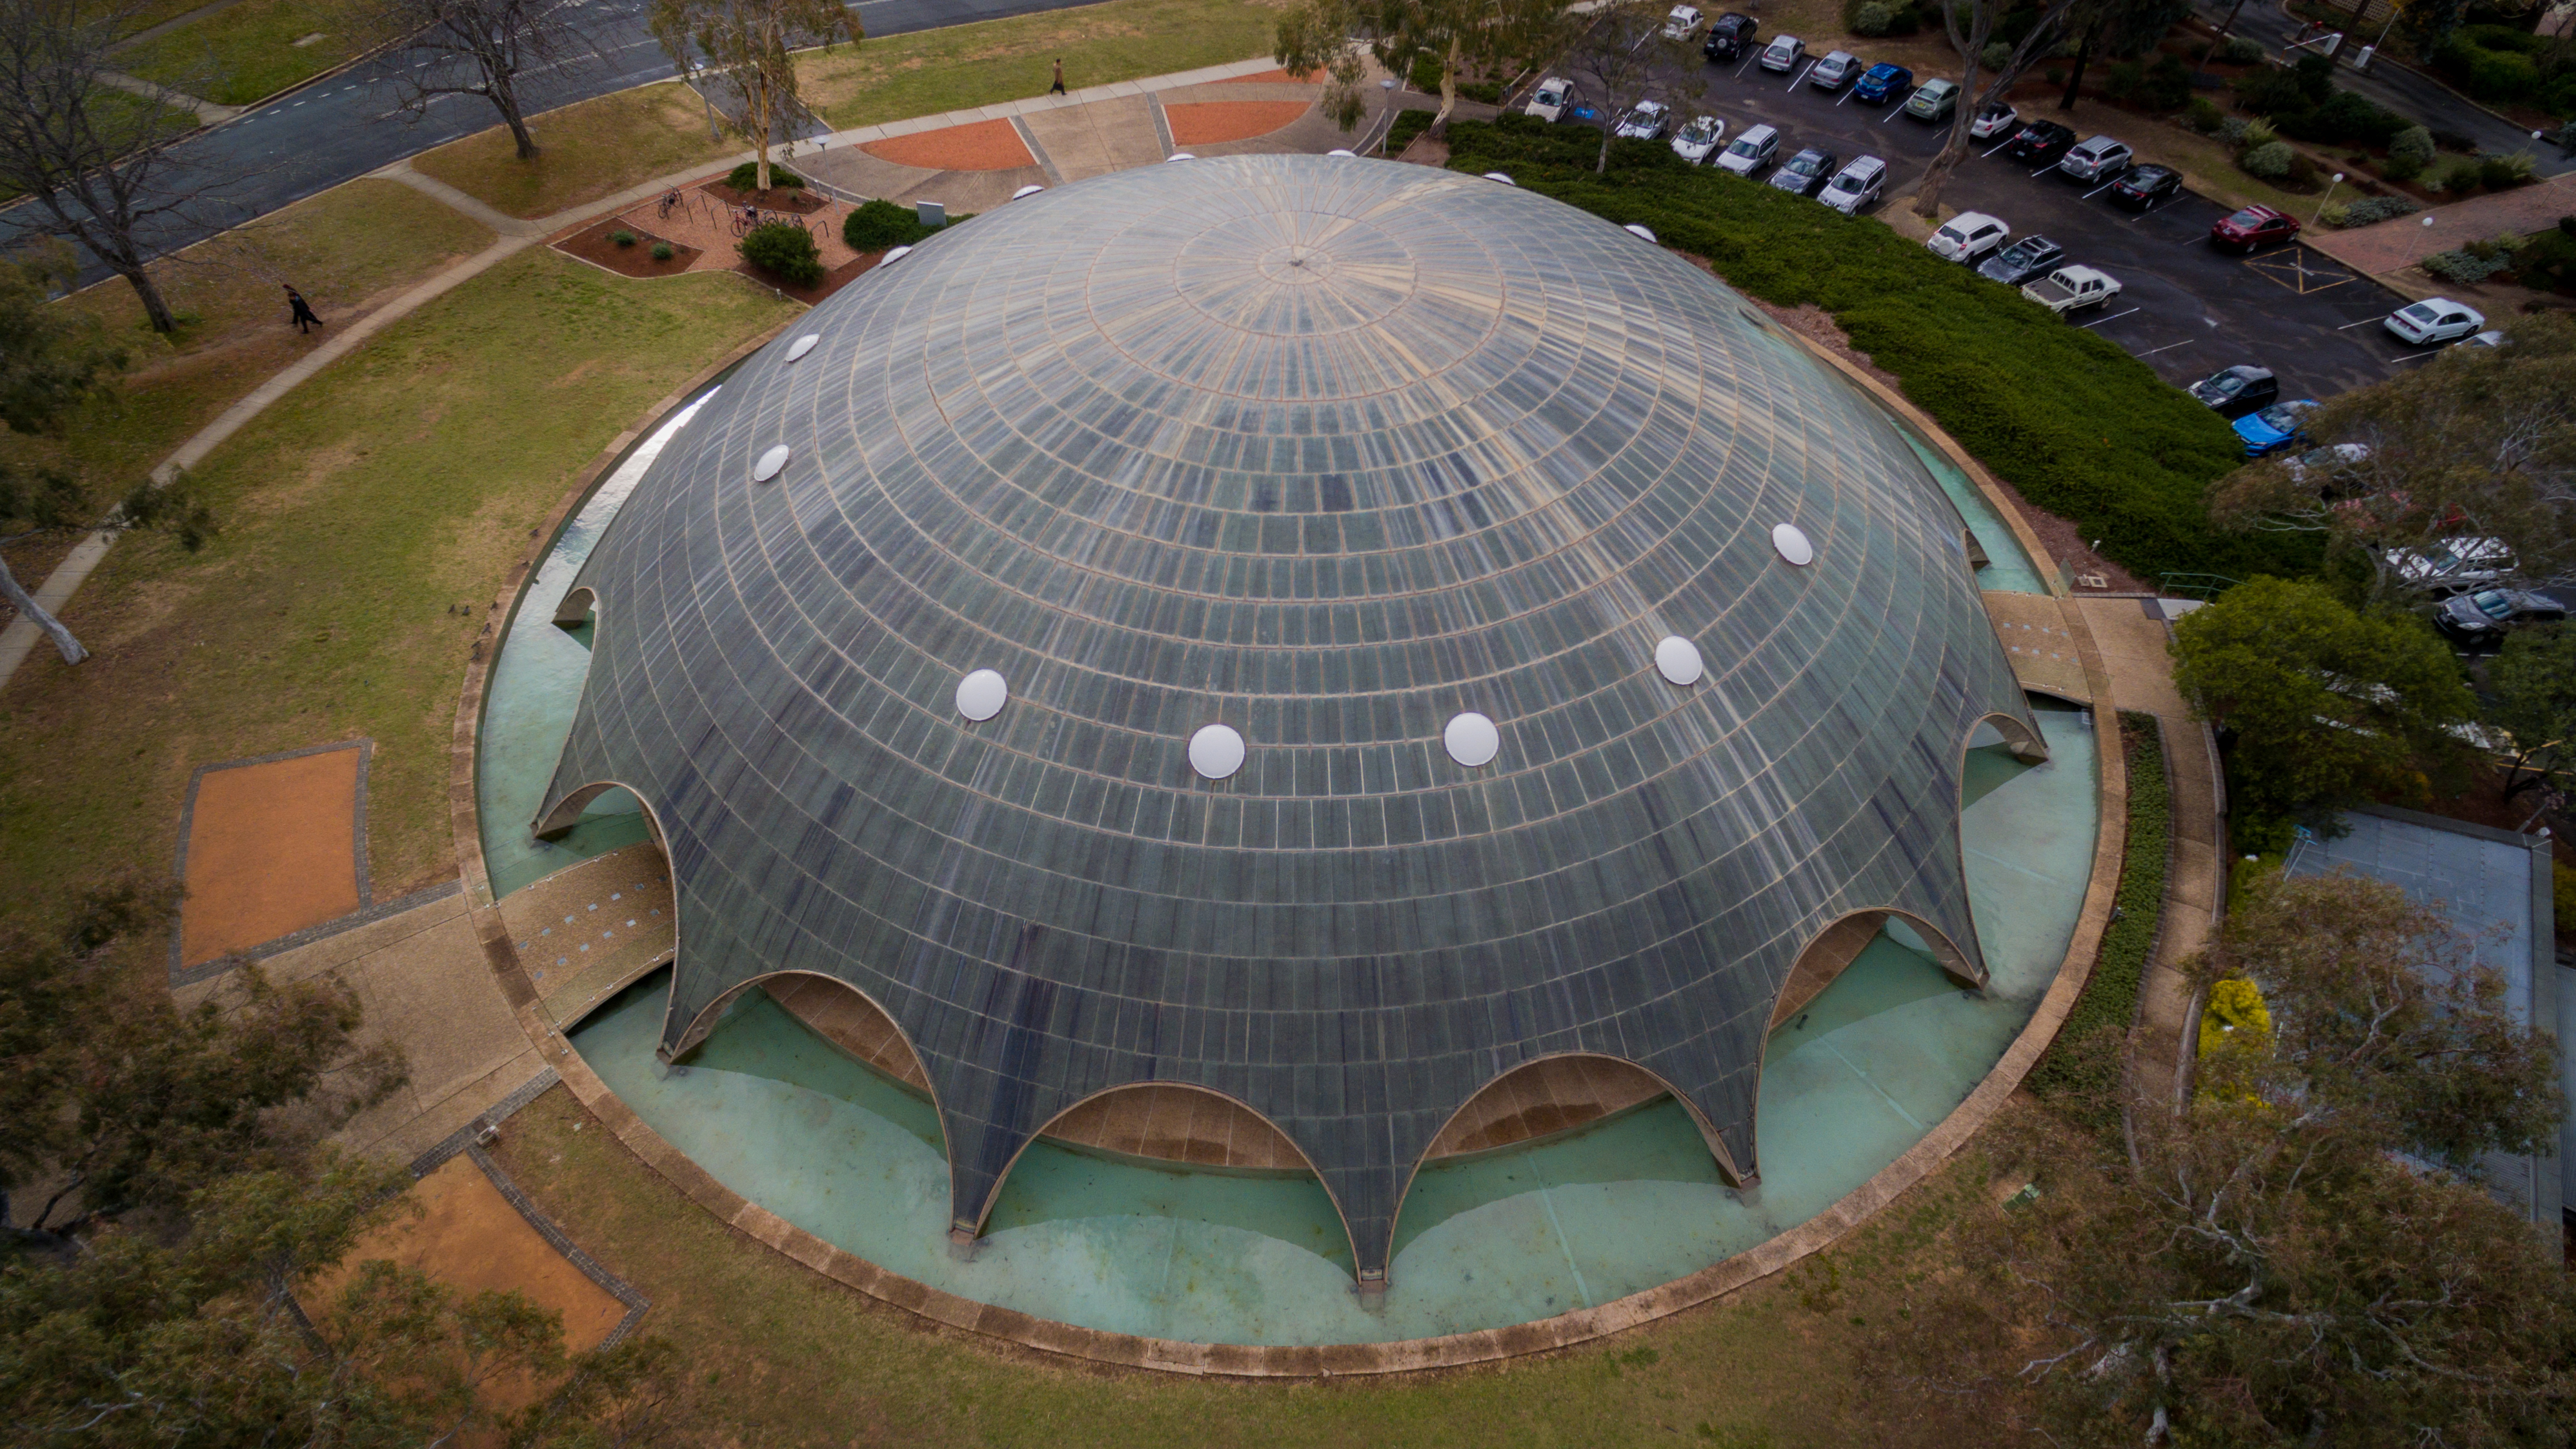
Completed in 1959 and reflecting some of the more adventurous architectural ideas of that time, the Shine Dome (previously known as Becker House) remains one of the most unusual buildings in Australia.
The dome—roof, walls and structure combined—dives down beneath the still water of its moat to give the sense that it is floating. From the walkway between the moat and the inner walls, the arches provide a 360° panoramic sequence of 16 views of the capital city and the hills beyond.
The Shine Dome was conceived before Canberra's Lake Burley Griffin existed, before microchips, and before manned space travel. It was created in the visionary scientific era of Sputnik, the first artificial satellite to orbit the Earth.
The dome came about because the Australian Academy of Science needed a home. In the early 1950s, under the founding Presidency of Sir Mark Oliphant, the new Academy and its 64 Fellows set about finding funds to create a building of its own. The Academy, which had been using offices in the Australian National University, recruited some eminent industrialists to its cause and received its first cheque (for £25,000) from BHP. Thus encouraged, Fellows both provided funds and encouraged their business associates to do the same. The dome, which cost a total of £260,000 to build, was completed in 1959 and named Becker House, recognising Sir Jack Ellerton Becker's £100,000 donation.
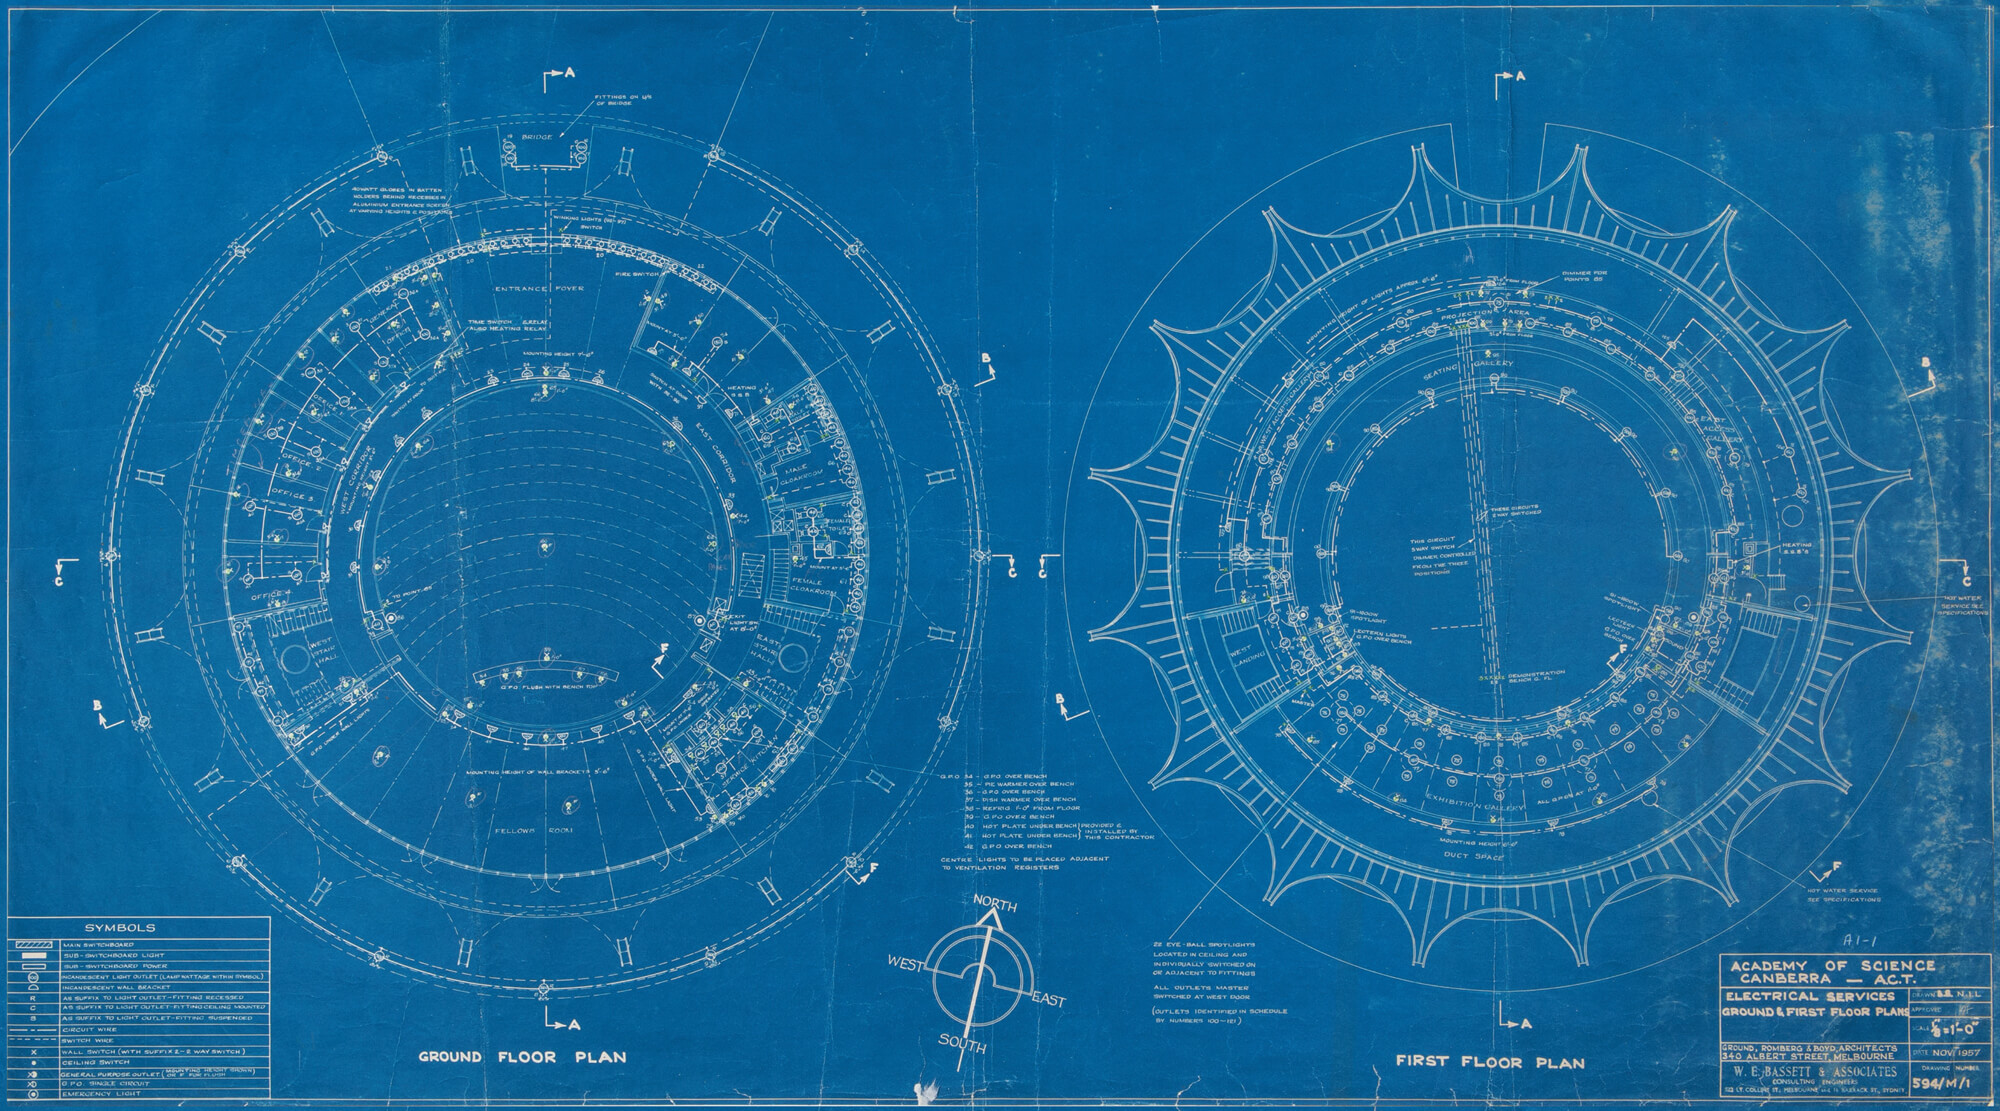
Once the Academy had found a suitable site, the next step was to select an architect. Six architects were invited to submit plans to a competitive process, and on 1 December 1956 the Academy's Building Design Committee met in Adelaide to look at them. The committee wanted a building that would be of a very high order aesthetically, judged from a non-traditional standpoint.
The committee settled upon the most radical design and their decision was unanimously approved by Council. Grounds, Romberg and Boyd were seen as the most influential Australian architects of their time.Roy Grounds was the sole architect on the Academy's building: it was his design that won the commission.
Unique features and challenges
The radically different building created radically different problems for the architects and engineers involved. Some doubted it could be built. Nobody knew how to calculate the stresses created by a 710 tonne concrete dome perched on 16 slender supports. This was vital, because if they got it wrong the whole dome might collapse when the building supports were taken away. In the end they grappled with the problem by building a one-fortieth scale model to see if it would work.
Those who trusted the model were proved right. When the massive concrete dome was built and the forest of wooden formwork and supports removed, the top of the dome dropped less than a centimetre as it took its own weight. It was a triumph for those who worked on the calculations and the model.
But getting the 'roof' on was only half the battle. In the centre of the dome was a lecture theatre for 150 people – and the big concrete umbrella did some strange things to sound. Again, the problems were new ones, and it took a great deal of work by acoustic engineers to get the sound right. The solution was to use a complex series of acoustic baffles to control the sound. Some were suspended from the ceiling and others built as part of long wooden panels on the walls. After much trial and error, the sound problem was solved.
Then a whole new and totally unexpected problem emerged. It became apparent that the elegant eucalyptus sound baffles gracing the walls created a form of optical interference, rendering about half of the people in the room nauseous. It took quite some time to find a solution, but eventually a Fellow, Dr Victor Macfarlane, who worked at the John Curtin School of Medicine at the ANU, came up with the idea of filling in the visually offending gaps with strings. This fixed the optical problem without spoiling the acoustics.
The concrete roof of the dome is sheathed in copper – and under the copper is a layer of vermiculite which partly insulates the interior from outside temperatures. This provides a degree of thermal inertia and the temperature of the dome's underside is roughly an average of the outdoor temperature of the previous 24 hours. It can become unpleasantly hot after a February heatwave or chilly after an August cold spell. However, a natural gas heating system helps keep the building warm in winter. In the summer the sloping roof shields the windows from direct sunlight.
Opening the dome
The dome's foundation stone was laid on 2 May 1958 by Prime Minister Robert Menzies, and founding Fellows Sir John Eccles, Sir Mark Oliphant. Each spoke eloquently about the founding of the Academy and the importance of science to Australia and the world. On 6 May 1959 luminaries of science and politics gathered to witness the Governor-General, Sir William Slim, officially open the dome.
Later additions
In 2000 the dome was completely restored and updated with a new cooling system. These major works were supported by a donation of $1 million from a Fellow, Professor John Shine, and a grant of $525,000 from the National Council for the Centenary of Federation. In recognition of this donation, the building is now named the Shine Dome.
A capital landmark
For its unique architecture and status as a landmark, the Shine Dome was included in the National Heritage List on 21 September 2005. For many years the Dome has been an iconic landmark of the national capital. It has featured in news backdrops, on posters, postcards, teatowels and even as a souvenir fridge magnet. The Shine Dome, which has won a number of national and international architecture awards and citations, continues to fascinate visitors to Canberra.
Heritage buildings
The Shine Dome was purpose-built during 1958–59 to house the Australian Academy of Science. The building was designed by Sir Roy Grounds of Grounds, Romberg and Boyd.
The Dome contains a central lecture theatre surrounded by meeting rooms on the ground floor, an upper level with gallery seating, and a basement area. It also contains the Basser Library and Fenner Archives.
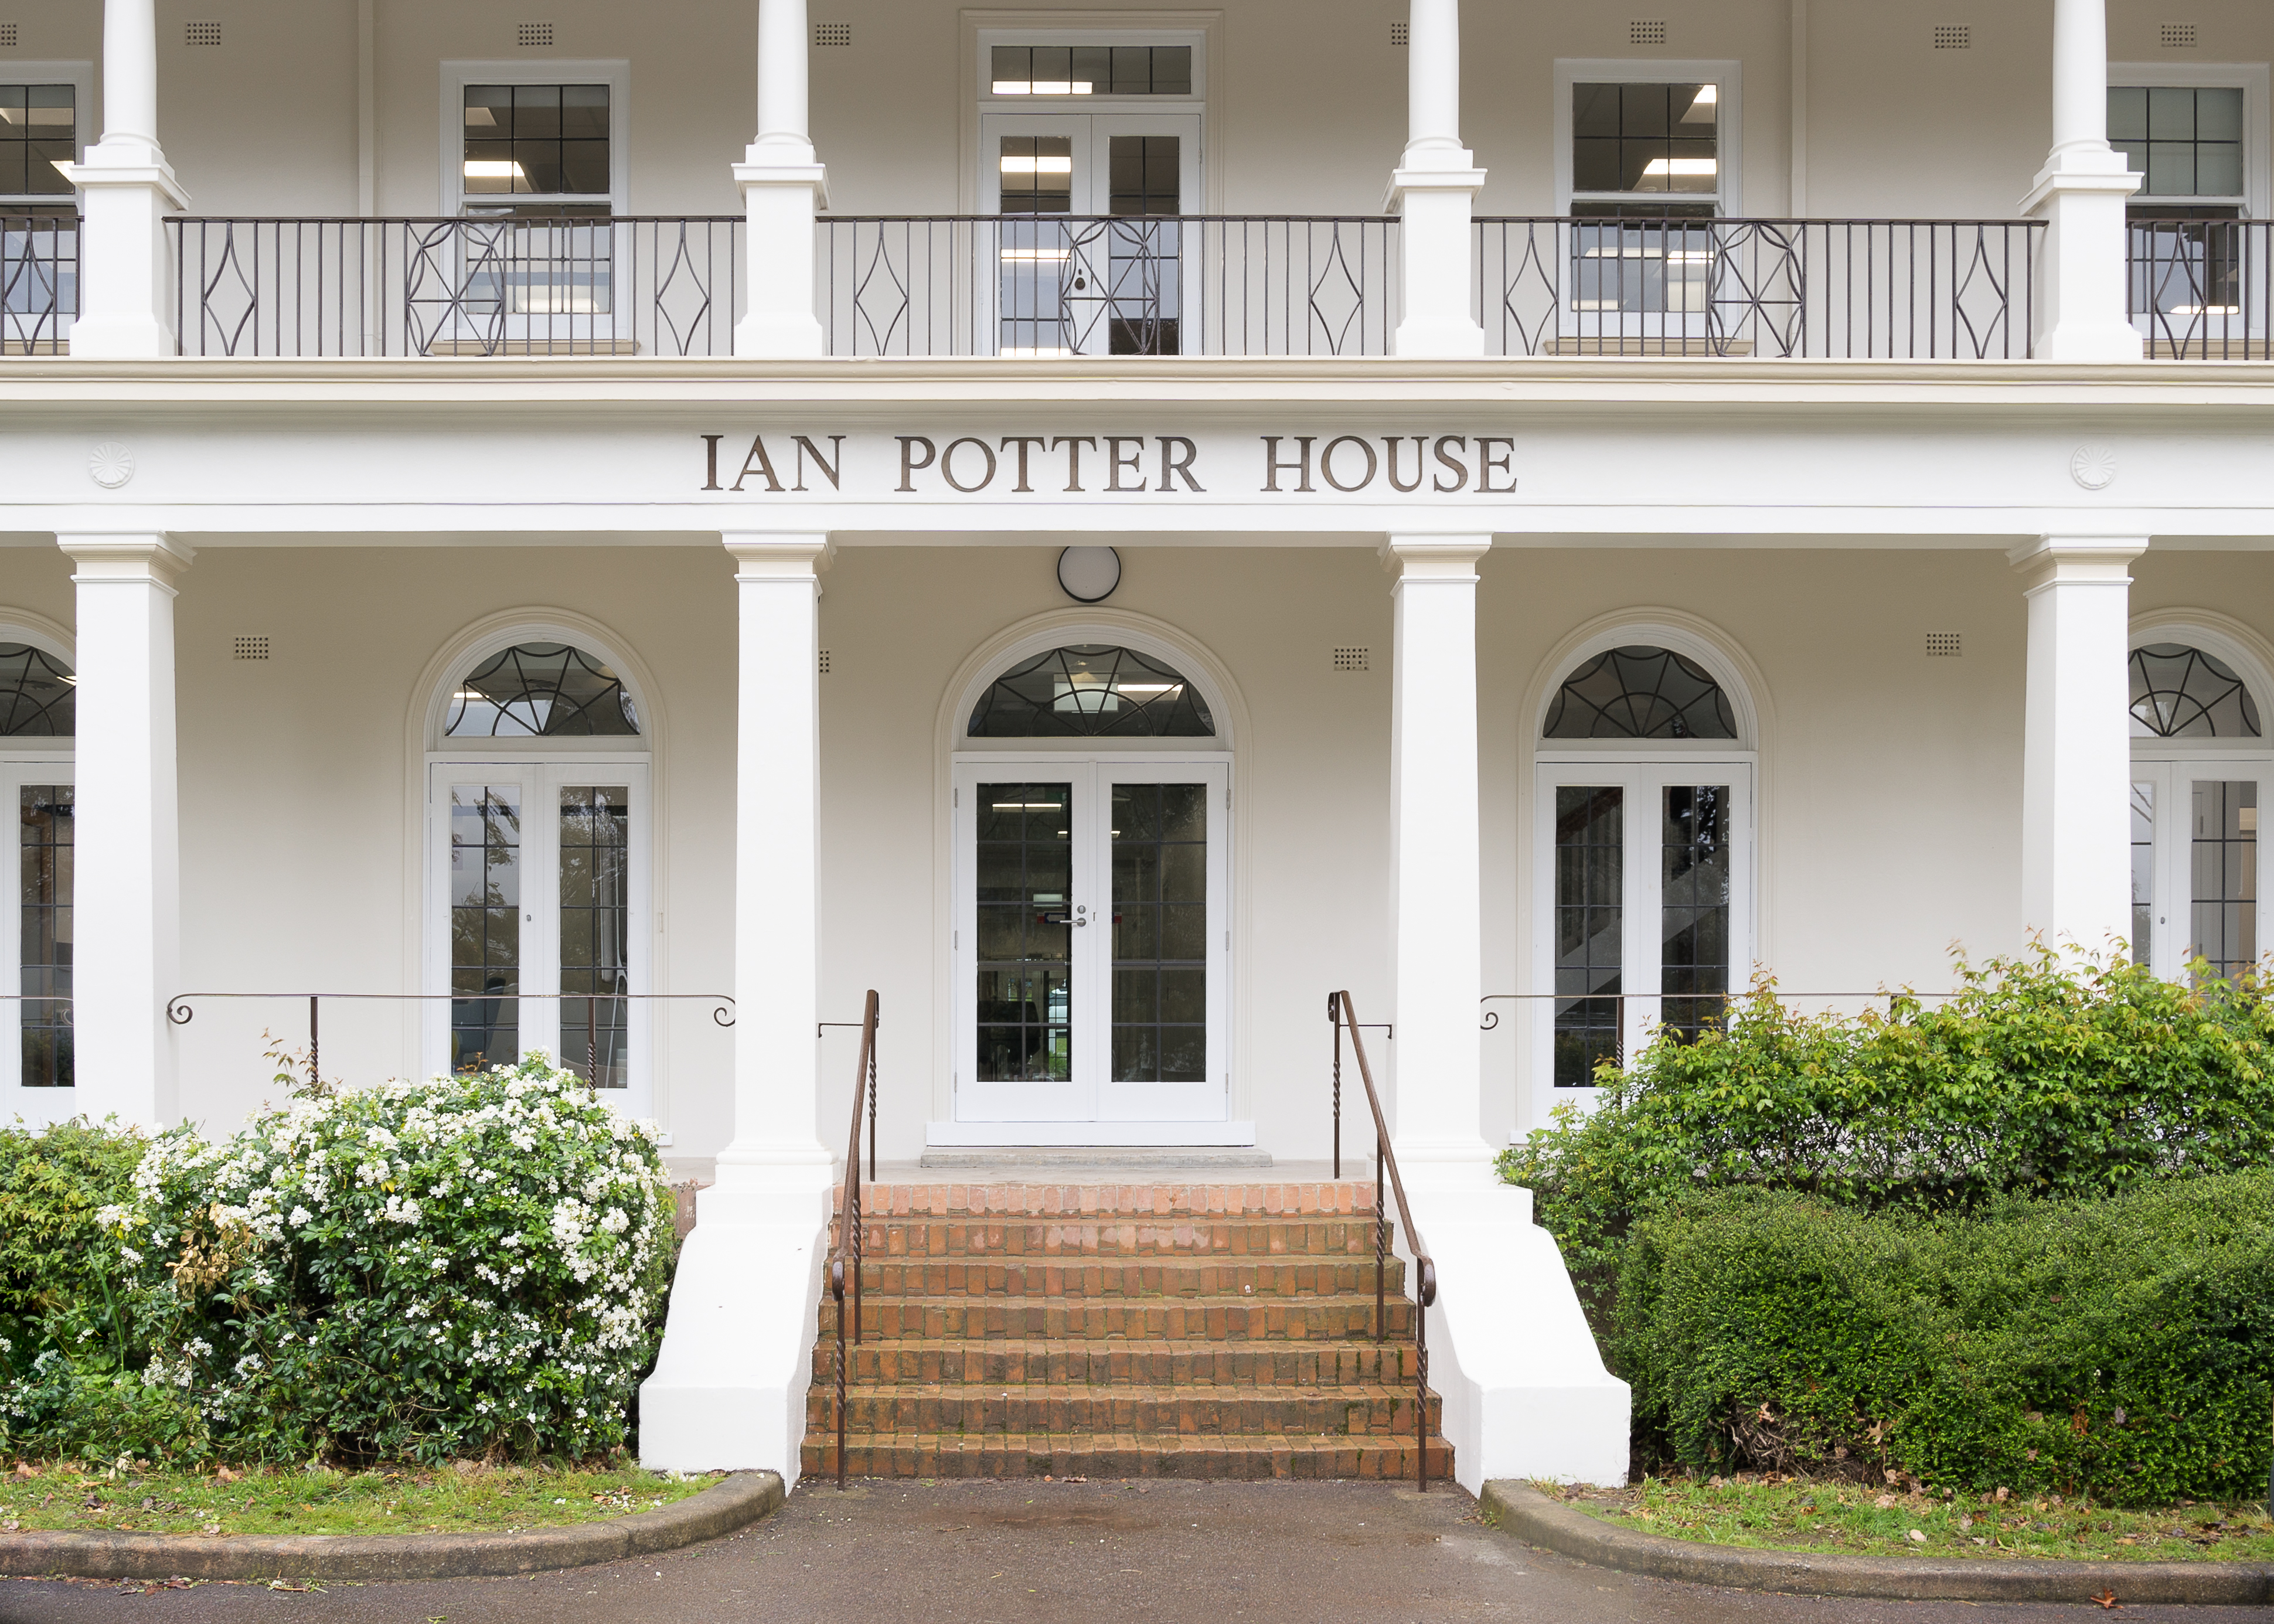
The Dome is one of the two culturally significant buildings owned by the Australian Academy of Science. Ian Potter House, the other building, houses the Academy secretariat.
Ian Potter House was built as part of the Federal Capital Commissions building program in 1927, the building represents an early phase in Canberra’s developing social and cultural history. It was the winning design by Melbourne architects, Anketell and Kingsley Henderson, in a competition held by the Federal Capital Commission.
The Australian Academy of Science took possession of the site in 1985 and, following refurbishment during 1986–87, gave the building its current name in recognition of philanthropist and Academy Fellow, Sir Ian Potter.
Diversity Strategic Statement 2022–2025
In February 2022, the Academy published its Diversity Strategic Statement. Recognising diversity in all its forms is a core pillar of the Academy’s vision for a scientifically informed Australian community that embraces excellence in science and is guided by and enjoys the benefits of scientific endeavour.
Download the Diversity Strategic Statement 2022–2025 (PDF, 200KB)
Related information

Diversity Strategic Statement 2022–2025
Introduction
Recognising diversity in all its forms is a core pillar of the Australian Academy of Science’s vision for a scientifically informed Australian community that embraces excellence in science and is guided by and enjoys the benefits of scientific endeavour.
The Academy recognises that diversity is critical to excellence in science. A diverse and inclusive science community that brings together the widest range of talents, backgrounds, perspectives and experiences, maximises scientific innovation and creativity, as well as the competitiveness of Australia and its scientific industries.
The strategy for 2022-25 sets out how the Academy will use its leadership and convening power, in partnership with others, to increase diversity, support, create and develop a more inclusive science, technology, engineering and mathematics (STEM) sector.
It builds on the aims and achievements of the previous diversity strategy 2018–2021 that sought to achieve a steady shift in diversity and inclusion in STEM. Implementation includes changing language for key Academy processes including Awards and nominations for Fellowship, reforming underlying processes to mitigate potential bias and providing strategies for mentoring relevant committees and panels in best-practice decision-making.
The Academy steadily gained recognition as a trusted leader in diversity and equity through the significant change in gender balance of elected Fellows, establishing Champions of Diversity for mentoring potential diversity candidates for nomination, delivery of the Women in STEM Decadal Plan, establishing Science in Gender Equity (SAGE) initiative, introducing awards for underrepresented groups and enhancing the tradition of providing a forum for strong support of early-and mid-career researchers.
Strategic objectives
Strategic objective 1: Continue to nurture a culture within the Academy that encourages and promotes diversity and inclusion
Continue to ensure that the Academy promotes and encourages diversity among the Fellowship and Committees, its awards and grants schemes, and all other aspects of the Academy’s work, through:
- reporting regularly to the Academy’s leadership on the diversity of the Fellowship and staff to inform deliberations at the highest levels
- ensuring robust diversity and equity processes apply across all Academy activities in order to consider all dimensions of diversity and to enable an intersectional approach
- developing tools to measure its diversity and inclusion activities benchmarked against best available evidence and regularly analysing data to identify areas of success and improvement and affirm the commitment of leaders
- analysing these data regularly to identify areas of success and improvement and to inform continual improvement of processes
- implementing systems and practices that support the collection and management of data and insights to measure progress, with provision of appropriate privacy protection
- developing a culture of regular communication and continual improvement that reviews and makes recommendations to Council on the diversity strategy, and the policies and operational practices of the Academy, that are best practice and in line with leading-edge community expectations.
Strategic objective 2: Address barriers to participation in STEM
The Academy recognises that many people from a range of backgrounds are currently under-represented in STEM education, training and employment. The Academy will continue to identify and combat barriers to participation and progression for these groups, through:
- continuing to support national policy initiatives and frameworks, including maintaining momentum and support for the Women in STEM Decadal Plan across the full STEM ecosystem
- actively supporting policy and research initiatives, as resources allow, that identify barriers to participation in STEM for under-represented groups, and monitor trends and identify contemporary solutions through our active participation in diversity networks such as Diversity Council Australia
- supporting the development of the evidence base that seeks to understand the barriers to participation in STEM, including the intersectionality of multiple barriers or identities, and unique issues facing specific groups
- communicating knowledge and learnings to the science community
- maintaining leading educational programs in STEM to inform and enthuse school students as resources allow
- continuing our strong history of supporting Australia’s early- and mid-career researchers (EMCRs) through the EMCR Forum, the Theo Murphy Initiative and other activities.
Strategic objective 3: Work in partnership to assess and maximise the effectiveness of diversity initiatives across the science community
The Academy will use its convening power to strengthen diversity efforts across the science sector, including:
- working closely with other learned academies, Science in Australia Gender Equity (SAGE), Indigenous science networks, and other STEM stakeholders across the science community on a range of diversity initiatives, not limited to gender equity. We will share knowledge and identify opportunities for collaboration to strengthen diversity in all its forms in STEM
- supporting other organisations that are proactively addressing diversity and inclusion in STEM by profiling their activities to Academy networks and the public
- convening communities of interest, such as the Women in STEM Decadal Plan Champions network, to identify priorities to advance gender equity and greater diversity in STEM.
Strategic objective 4: Recognise and champion the achievements of a wide range of scientists from under-represented groups
The Academy will continue to recognise and champion the achievements of a wide range of scientists from under-represented groups to provide visibility of STEM pathways to all Australians, through:
- advancing reconciliation, creating opportunities to work respectfully with Aboriginal and Torres Strait Islander peoples, supporting their contribution to scientific activities, and increasing understandings of Indigenous knowledge, through our Reconciliation Action Plan
- increasing diversity of nominees for Academy awards and grants
- increasing diversity of nominations for Fellowship
- seeking to secure continued support for STEM Women – a dynamic, curated online directory of Australian women working in STEM across industry and academia showcasing the breadth of scientific talent in Australia, enabling a diverse range of women to be offered exciting opportunities to showcase and progress their careers and personal capabilities.
Governance
Our Equity and Diversity Reference Group is an advisory body to the Academy’s Council, providing recommendations to improve diversity and to uphold the principles of inclusion, equal opportunity, fairness and transparency in Academy policies and procedures.
Authorisation and review
The Diversity Strategic Statement was endorsed by the Academy Council in February 2022. The statement will be reviewed by Council annually or more often if required.
Diversity and inclusion

Acknowledgement of Country
The Australian Academy of Science acknowledges and pays respects to the Traditional Owners of all the lands on which the Academy operates, and where its Fellows and employees live and work. The Academy recognises Australia’s Aboriginal and Torres Strait Islander peoples as the first innovators and scientists of this land and honour their enduring connection to Country, from which we are committed to learn. We pay our respects to, and recognise the cultural authority of, their Elders past and present.
The Australian Academy of Science aims to be a national leader in diversity and inclusion in Australia’s science sector.
The Academy is committed to supporting excellence in science and empowering the next generation of scientists. As recognised in our strategic plan, we recognise that to achieve this we must celebrate and embrace diversity and inclusion in all its forms and embed diversity and inclusion in everything we do.
As a national academy we have a responsibility to model, promote and influence best practice in diversity and inclusion in the science sector in Australia.
To support our work in diversity and inclusion we have adopted a Code of Conduct which clearly outlines conduct expectations, the values of the Academy and procedures for handling misconduct. The code is based on best practice and is binding for Fellows, staff and participants in all Academy activities. The Academy has established a Diversity and Inclusion Advisory Committee (DIACOM) that reports to Council and includes external experts in the field of diversity and inclusion.
The Academy is a proud member of Diversity Council Australia, a peak body leading diversity and inclusion in the workplace. This membership not only provides the Academy with resources to assist in supporting our diverse workforce and our inclusion activities, it also identifies the Academy as an employer of choice. We were recognised by Diversity Council Australia as an Inclusive Employer 2023–24 following our participation in its Inclusive Employer Index.
Fellowship
Working towards gender balance
The gender imbalance of the Fellowship is an important issue for the Academy. As of 1 February 2025, women comprise 20% of our 609 Fellows, and we have worked hard in recent years to address this issue. Our actions to improve diversity are succeeding—over the past five years (2020-24), 40 women have been elected (by Ordinary and Special Election) into the Academy, representing 39% of the Fellows elected during that time. This has been achieved by adopting a range of best practice measures to improve our nominations process and increase opportunities to recognise all scientists. Learn more about the election process.
The Academy’s Executive Committee comprises seven Officers of Council, and women currently fill the following three Officer positions: Foreign Secretary; Secretary for Education and Public Awareness of Science; and Treasurer.
Leadership
We have appointed more than 35 ‘Champions of Diversity’ within the Fellowship to be ambassadors in each scientific discipline across the country, tasked with identifying diversity candidates and proposers to put forward nominations for Fellowship and awards.
Professor Cheryl Praeger, former Foreign Secretary of the Australian Academy of Science, chairs the Association of Academies and Societies of Sciences in Asia (AASSA) Special Committee for Women in Science and Engineering (WISE). In 2018, WISE published Profiles of Women Scientists in Asia: Their inspirational stories, featuring 50 researcher profiles from across the AASSA membership countries in a celebration of the dedication, passion and resilience of women in science throughout the region.
The Academy successfully nominates women scientists to international scientific committees. For example, Academy Fellow Professor Nalini Joshi is Vice President of the International Mathematical Union Sciences, and Dr Helen Cleugh is a member of the joint scientific committee of the World Climate Research Programme.
Gender equity
Women in STEM Decadal Plan
We have developed the Women in STEM Decadal Plan in collaboration with the Australian Academy of Technology and Engineering. The plan provides a 10-year roadmap for achieving sustained increases in women’s STEM participation and retention from school through to careers.
Action is being taken by Women in STEM Decadal Plan Champions—members of the STEM ecosystem who have agreed to publicly align their gender equity journey with the decadal plan. Learn more about the Women in STEM Decadal Plan Champions.
Science in Australia Gender Equity (SAGE)
We partnered with the Australian Academy of Technology and Engineering to roll out the Science in Australia Gender Equity (SAGE) pilot. The pilot is now complete. To find out more about this project visit the SAGE website.
STEM Women
STEM Women is a dynamic, curated online directory of Australian women working in STEM across industry and academia. Developed in partnership with Science & Technology Australia, CSIRO and the Australian Science Media Centre, the directory aims to promote gender equity in STEM by showcasing the breadth of scientific talent in Australia, enabling a diverse range of women to be offered exciting opportunities to progress their careers and personal capabilities.
STEM Women ASIA
Building on the success of the Academy’s successful Australian version of the STEM Women platform, STEM Women Asia was launched in September 2021, extending the STEM Women network to women in Asia and Oceania. Featuring profiles of women from more than 30 countries, the Academy is committed to growing the exciting opportunity offered by STEM Women Asia as a platform to increase the representation of all women at all stages of their STEM career.
Panel pledge
The Academy Council has taken the Panel Pledge, agreeing to only participate in events where efforts have been taken to ensure women have meaningful representation. Learn more about the Panel pledge.
Awards and grants
We are continually seeking to increase diversity of nominees for all our grants and awards.
The following are some of the measures that have been taken to improve gender equity in our awards program:
- Introducing a career interruption step to the application process, allowing eligibility extensions for affected candidates.
- Committees can recommend joint awards.
- Two medals have been created to recognise the achievements of women in science.
The Ruby Payne Scott Medal and the Nancy Millis Medal recognise achievements by women scientists at the career and mid-career levels respectively. These medals are open to nominees who self-identify as a woman in the award nomination form. The Academy does not require any statement beyond a nominee’s self-identification in the nomination form.
This practice is consistent with the Sex Discrimination Act 1984, which has recognised the non-binary nature of gender identity since 2013, and gives effect to Australia’s international human rights obligations. The Academy remains committed to the fundamental human rights principles of equality, freedom from discrimination and harassment, and privacy, as well as the prevention of discrimination on the basis of sex and gender identity.
Award committees are comprised of Academy Fellows, former awardees, and other experts in the relevant fields. Each award is decided by a separate committee. Following the awards Terms of Reference, the Academy aims to reflect appropriate geographical spread, gender and ethnic diversity within each committee. All members are requested to undergo unconscious bias and group think training over the course of the assessment process.
Increased accessibility
The Academy wants to ensure everyone can participate fully in our events. During our annual flagship event, Science at the Shine Dome, we offer assistance to support the attendance of delegates who would not otherwise be able to attend or who face obstacles to their attendance. Previously this has included onsite childcare and carer’s assistance grants. Accessibility assistance for speakers is also offered across Academy-run events such as the Canberra Speakers Series, and is strongly encouraged at Academy supported events.
Aboriginal and Torres Strait Islander people
Reconciliation Action Plan
We are committed to advancing reconciliation, creating opportunities to work respectfully with Aboriginal and Torres Strait Islander peoples, supporting their contribution to scientific activities, and increasing understandings of Indigenous knowledge.
See our Innovate Reconciliation Action Plan
See our progress towards reconciliation
Find out more about our Aboriginal and Torres Strait Islander Scientist Award
Early- and mid-career researchers
The EMCR Forum Executive
The Early- and Mid-Career Researcher (EMCR) Forum is the national voice of Australia's emerging STEM researchers. It champions improvement in the national research environment for EMCRs through advocacy.
Theo Murphy Initiative (Australia)
Through the Theo Murphy Initiative (Australia), the Academy conducts 3-6 activities and events annually to support Australia’s EMCR community. The purpose of these activities is to provide tangible benefits to EMCRs to support their careers and ultimately further scientific discovery.
Careers
The Australian Academy of Science was founded by Royal Charter in 1954 and more than 600 of Australia’s leading scientists are currently Fellows. The Academy is an independent not-for-profit organisation that recognises outstanding contributions to science and research, provides expert advice to government, contributes to the development of science policy, promotes science education and public understanding of science, and fosters international scientific relations. Our positions are part of a Secretariat of about 65 people who work as a team to support activities undertaken by the Academy.
Current opportunities
There are currently no opportunities at the Academy.