


Why investment in Australia’s supercomputing should matter to every Australian


Ahead of the 2025 federal election, the Australian Academy of Science is proposing an investment of $200 million per year over 10 years to urgently modernise Australia’s high-performance computing and data infrastructure – our supercomputers – which are reaching their end of life and cannot meet the growing demands of science, defence, industry and society.
The Academy is also calling for the development of a 10-year plan to meet our future supercomputing needs, rather than taking a just-in-time funding approach to critical infrastructure.
Supercomputers play a vital role in all our lives. They:
- give vital information to our farmers to improve agricultural yields, which lowers food prices in supermarkets
- provide climate intelligence that helps us prepare and respond to natural disasters, minimising flood and bushfire damage that keeps insurance costs in check
- enable personalised cancer care that reduces suffering and loss and improves overall healthcare.
Learn more about the Academy’s proposal
Read our comprehensive proposal on high-performance computing and data.
Download the fact sheet (PDF, 440KB)
CASE STUDIES
Investing in supercomputing will improve the lives of Australians
High-performance computing and data (HPCD) improves agricultural productivity by optimising planting schedules and resource allocation, leading to higher yields and lower food prices. It provides information that enhances disaster preparedness and response, minimising economic damage from floods, bushfires, and extreme weather events that drive up repair and insurance costs.
CASE STUDY: Phoenix RapidFire
Phoenix RapidFire is an application that simulates the spread of one, or more, fires across the landscape. This is more than just a computer program, and has already saved towns from bushfires – saving lives as well as homes, businesses and other infrastructure.
The simulation implements a fire characterisation model capturing detail such as flame height, intensity, size, ember density and asset impact throughout the simulation process. Both Victoria and NSW RFS have used this model to manage bushfires.
As bushfires increase in frequency and become more severe, we will need more detailed monitoring and simulation to improve our response to these events before they become devastating.
HPCD also supports energy grid optimisation, efficiently integrating new energy technologies like renewables to lower energy bills. By advancing healthcare research, HPCD accelerates the development of cost-effective treatments, reducing out-of-pocket expenses.
CASE STUDY: Personalising cancer treatment
Australian supercomputers are used to power the ZERO Childhood Cancer initiative, where every Australian child with cancer has access to personalised treatment.
Personalising cancer treatment means less pain and suffering, less strain on the healthcare system, better outcomes including long-term impacts, and fewer out of pocket expenses for the family.
With increased supercomputing capacity – we could expand this type of treatment for other cancers and diseases, improving the health of Australians and reducing the burden on our healthcare system.
Investing in supercomputing will create tech jobs and drive innovation
Supercomputing strengthens sectors including artificial intelligence (AI), biotechnology and advanced manufacturing, creating demand for skilled workers. Australia will not be able to maintain tech industries, or retain skilled workers like engineers, data scientists and software engineers if we continue to fall behind in computing infrastructure.
The recent rise of DeepSeek highlights the competitiveness of AI innovation – and that nations other than the United States still have an opportunity take a make their mark in AI research and products.
CASE STUDY: Producing green hydrogen from seawater
Breaking ground on new industries from supercomputing research will create highly skilled tech jobs, and advance the Australian path to net zero.
Researchers are using an Australian supercomputer in the search to find a new material that could significantly improve the process of producing green hydrogen directly from seawater. Finding new materials offers the opportunity to build new industries in Australia.
Without reinforcing our rapidly ageing supercomputing infrastructure – we will lose these opportunities.
Investing in supercomputing will boost national competitiveness
AI and supercomputers are already becoming a global currency, a valuable asset driving the biggest wins and loses of the global stock market and impacting economies globally.
There is increasing competition to secure computing infrastructure, and companies like Microsoft Azure, Amazon Web Services and Oracle looking to invest in infrastructure in Australia. These companies are looking for signals to follow from government investment – investing in supercomputing will drive co-investment in on-shore capability from the business sector.
CASE STUDY: Designing better batteries
More powerful and lighter batteries are needed to take the electrification of vehicles from cars to trucks and planes. Discovering the next generation of battery technologies could place Australia at the forefront of this booming industry.
An Australian supercomputer is being used to understand exactly what happens between the anode and cathode of next-generation lithium-metal batteries in search of the best materials to ensure safe and reliable operation of these powerful batteries.
The next generation of supercomputers could fast-track the time to discover these new materials and place Australia at the front of the queue.
Investing in supercomputing will safeguard national security
Supercomputers onshore means that sensitive Australian data stays on shore, and we are front of the line for new discoveries. The next generation of computing has the potential to unlock new critical technologies currently unimaginable.
Defence's supercomputing capability is vital in the design, development and analysis of modern weapon systems and national security systems.
CASE STUDY: Jindalee Operation Radar Network
Supercomputers enable the use of technologies such as high-frequency, skywave over-the-horizon radar technology used in the Jindalee Operation Radar Network (JORN). JORN provides 24-hour military surveillance of the northern and western approaches to Australia, and also can assist with detecting illegal entry, smuggling and unlicensed fishing.
As weapons and critical technologies quickly develop, we need to reinforce our sovereign capability that allows us to monitor for threats and respond to them.
THE ACADEMY’S PRE-BUDGET SUBMISSION
Investing in high-performance computing and data infrastructure was one of the four inclusions in the Academy's 2025-26 Pre-Budget Submission.
Read our media release
Read the Academy's 2025-26 Pre-Budget Submission
2025 awardees
The Australian Academy of Science’s honorific awardees for 2025.
About the honorific awards
Central to the purpose of the Academy is the recognition and support of outstanding contributions to the advancement of science.
See our award feature stories on Antarctic research and breast cancer research.
On this page: Award citations and awardee videos
Premier honorific awards
- Matthew Flinders Medal and Lecture – Yuri Kivshar
- Ruby Payne-Scott Medal and Lecture – Jane Visvader
Career honorific awards
- David Craig Medal and Lecture – Alison Rodger
- Hannan Medal – Noel Cressie
- Jaeger Medal – Hugh O’Neill
- Suzanne Cory Medal – Steven Chown
- Thomas Ranken Lyle Medal – George Willis
Mid-career honorific awards
- Jacques Miller Medal – James Hudson
- Nancy Millis Medal – Natasha Hurley-Walker
Early-career honorific awards
- Anton Hales Medal – Stijn Glorie
- Christopher Heyde Medal – Anita Liebenau
- Dorothy Hill Medal – Linda Armbrecht
- Fenner Medal – Katherine Moseby
- Fenner Medal – Daniel Noble
- Gottschalk Medal – Amy Cain
- Gottschalk Medal – Shom Goel
- John Booker Medal – Qianbing Zhang
- Le Fèvre Medal – Fengwang Li
- Moran Medal – Margarita Moreno-Betancur
- Pawsey Medal – Claudia Lagos
- Pawsey Medal – Daria Smirnova
- Ruth Stephens Gani Medal – Ira Deveson
Premier honorific awards
2025 Matthew Flinders Medal and Lecture
Professor Yuri Kivshar FAA, Australian National University
Optics is the art of manipulating light through devices including lenses, gratings and nonlinear crystals. Photonics allows us to use light for many applications. Professor Yuri Kivshar is a pioneer in optics who has described with his team whole new classes of materials and devices by combining the properties of nonlinear and structures patterned on a sub-wavelength scale. He is globally recognised for introducing the field of metaphotonics using artificial materials with novel properties and applications. Professor Kivshar is one of the founders of all-dielectric resonant metaphotonics that derives unique functionalities from electric and magnetic Mie resonances. His work has led to the development of innovative photonic devices, such as chiral nanolasers, employed in a new generation of optical communication systems, biomedical sensing, and defence and security applications. He has trained a remarkable number of students and early-career researchers, with many of them now in leading positions in industry and academia worldwide.
2025 Ruby Payne-Scott Medal and Lecture
Professor Jane Visvader FAA FAHMS FRS, Walter and Eliza Hall Institute of Medical Research
Professor Jane Visvader is an esteemed scientific researcher in the field of breast stem cell biology, having made seminal discoveries that continue to define how the breast develops, how errors in that development lead to breast cancer, and how we might prevent or treat that cancer. Her outstanding contributions encompass fundamental research, translational discoveries, and an inspiring commitment to teaching and mentorship. Professor Visvader’s research leadership has provided a series of important discoveries that underpin our current understanding of breast stem cell biology, including the isolation of mouse breast stem cell, which provided methodologies now used in research laboratories worldwide; defining the sensitivity of breast stem cells to ovarian hormones and their impact on the development of breast cancer; discovery of the cellular origin of BRCA1-associated breast cancer; and validation of a specific cell signalling pathway as a therapeutic target to prevent breast cancer in people carrying a BRCA1 mutation.
Career honorific awards
2025 David Craig Medal and Lecture
Professor Alison Rodger FAA, Australian National University
Scientific advances invariably depend on the quality and diversity of available techniques and instrumentation and on the ability of researchers to understand the data that are produced. Professor Alison Rodger has spent her career inventing new spectroscopic techniques to advance understanding of the molecular world. She uses polarised light to give data about helical structures and molecular assemblies. She complements the experimental work by developing the theoretical frameworks required to enable use of the data in applications such as characterising the structure of biopharmaceutical products and understanding the basic biology of cell division. Professor Rodger’s most recent invention is that of linearly polarised luminescence where the intensity of polarised light emitted is used to characterise biomolecular assemblies such as DNA-drug complexes. She is passionate about working to ensure equality of opportunity and has benefited from working with a wide range of people from all over the world.
2025 Hannan Medal
Professor Noel Cressie FAA, University of Wollongong
Professor Noel Cressie is a world leader in statistical science for the analysis of spatial and space-time data, especially in environmental science. He has made pioneering, fundamental, ground-breaking, paradigm-shifting and highly influential contributions to theory, methodology and applications. Professor Cressie is a leading exponent of statistical methods in environmental science, especially for large-scale phenomena such as oceanic and atmospheric circulation and climate. By combining physical principles with stochastic models to capture uncertainties, he has developed powerful methodology to investigate causal links in these complex global processes. He has overcome daunting challenges to make the methodology computationally feasible for large and complex datasets. Professor Cressie has played a key role in applications to global CO2 flux, regional climate, sea surface temperature, air pollution, disease mapping, biogeochemical cycles, soil carbon dynamics, movement of glaciers and river pollution. His recent work on climate model uncertainty may ultimately have a substantial impact on science and policy.
2025 Jaeger Medal
Professor Hugh O’Neill FAA FRS, Monash University
Professor Hugh O’Neill is a widely recognised international leader in the field of experimental petrology and geochemistry with applications to the understanding of planetary processes. His research addresses many aspects of the chemical behaviour of minerals and rocks through detailed laboratory studies complemented by thermodynamic modelling. The resulting insights elucidate the diverse processes by which Earth and other planetary bodies were formed and their subsequent chemical evolution. His influential research has provided new insights into the formation of the Moon through the impact with Earth of a Mars-sized body, the segregation and composition of Earth’s iron-rich metallic core, the redox conditions prevailing within Earth’s interior, and the generation of basaltic magmas by partial melting within Earth’s upper mantle.
2025 Suzanne Cory Medal
Professor Steven Chown FAA, Monash University
Professor Steven Chown’s research concerns biodiversity variation through space and time, and the conservation requirements for mitigating the impacts of environmental change. He co-developed the field of macrophysiology – the investigation of large-scale patterns in and processes underlying physiological variation and their ecological implications. He has worked in Australia, Africa, the Asia-Pacific, the UK, and in the Antarctic, where he has over 30 years of field experience. For many years Professor Chown represented the international Scientific Committee on Antarctic Research (SCAR), of which he was also President (2016–21), at the Antarctic Treaty Consultative Meetings, providing scientific advice on a broad range of environmental and science policy matters. He has been National Delegate to SCAR for both Australia and South Africa. He provides a range of advice to international Antarctic programs through advisory committees and boards.
2025 Thomas Ranken Lyle Medal
Professor George Willis FAA, University of Newcastle
Beyond solving problems, Professor George Willis is a true creator of new mathematics. Through his invention of ‘the scale’ and its function, Professor Willis gave an entirely new insight into the unexpected structure and classification of totally disconnected locally compact groups, a previously intractable area. This novel approach, now known as ‘Willis Theory’, has broad implications for diverse fields of mathematics. Professor Willis’s research extends beyond theoretical elegance, leading to unexpected and pivotal real-world applications related to symmetric infinite networks. By describing how finite patterns might continue indefinitely, his work informs the growth and optimisation of real-world networks like computer systems and global social networks. In a lifetime of achievement, Professor Willis has ensured Australia is at the frontier of knowledge in pure mathematics. His ongoing contributions add to his already remarkable legacy of innovative academic research and dedicated education leadership in pure mathematics at the regional University of Newcastle in Australia.
Mid-career honorific awards
2025 Jacques Miller Medal
Professor James Hudson, QIMR Berghofer Medical Research Institute
Professor James Hudson is a rising star of Australian health and medical science who has already made a significant impact in translational medical science, and looks set to continue to do so into the future. Professor Hudson was awarded his PhD in 2011, and most of his research has been conducted in Australia. He is engaged in stem cell and organoid research with a clear translational focus. Professor Hudson sits at the very top of the highest rank of the next generation of Australian medical researchers. Evidence for this assessment is manifold, and includes such things as the quality and impact of his publications, recognition through awards and prizes, invitations to present at leading international meetings, the clear clinical and commercial potential of his discoveries, and his demonstrated capacity for leadership.
2025 Nancy Millis Medal for Women in Science
Associate Professor Natasha Hurley-Walker, Curtin University
Associate Professor Natasha Hurley-Walker has transformed our view of the radio sky. She uses powerful supercomputers to analyse petabytes of data from Western Australian telescopes to explore the universe. Her discoveries include the remains of stellar explosions, insights into the lives of supermassive black holes, and a new kind of repeating radio source unlike anything astronomers have seen before. Associate Professor Hurley-Walker has mapped the southern sky in ‘radio colour’, bringing a new view of the cosmos to the world. Giving public talks and media interviews, and filming for documentaries, she has reached tens of millions across the world, inspiring interest in STEM careers. Her work will help Australian astronomers find the unexpected with the Square Kilometre Array, which will be the world’s largest radio telescope.
Early-career honorific awards
2025 Anton Hales Medal
Associate Professor Stijn Glorie, University of Adelaide
Associate Professor Stijn Glorie studies the interplay between the thermal history of Earth’s crust and large-scale tectonic processes that drive plate deformation and mountain building. Associate Professor Glorie employs novel mineral-based geochronometers to unravel the cryptic records of ancient geologic events, including the formation of metalliferous mineral deposits, which in turn can assist mineral exploration efforts. His research has focused on the protracted crustal deformation in Central Asia, and vast areas of central Australia, thereby filling crucial gaps in our knowledge of the geological evolution of our continent. At the University of Adelaide, he is currently leading ground-breaking method development work to determine the age of a vast range of minerals that were previously considered undatable. This revolutionary geochronology work now allows for unlocking of records of Earth’s ancient history at unprecedented rates and scales.
2025 Christopher Heyde Medal
Associate Professor Anita Liebenau, University of New South Wales
Associate Professor Anita Liebenau is recognised internationally as a leading expert in extremal and probabilistic combinatorics. She has worked on enumeration problems of large discrete structures such as regular graphs, problems in Ramsey theory and combinatorial games played on graphs. Among her many achievements, she developed a breakthrough method for enumerating regular graphs, leading to the first progress since 1989. She has also proved important results on thresholds for games on graphs, and has made major contributions towards resolving the Erdős–Hajnal conjecture.
2025 Dorothy Hill Medal
Dr Linda Armbrecht, University of Tasmania
Dr Linda Armbrecht is a detective who uses fragments of ancient DNA preserved in the seafloor in the polar regions to determine what organisms lived in the oceans in the past. She has pioneered new techniques to minimise contamination and maximise the quantities of ancient DNA fragments that can be recovered from marine sediments. She uses the ancient DNA data to uncover how climate change has impacted Antarctic ecosystems over the last 1 million years. Dr Armbrecht’s work is helping to solve ancient mysteries about the evolution and adaptation of keystone species, such as plankton and krill, in response to past climate change. These species make up the base of the polar food webs and are an indicator of ocean health. This research provides important clues as to how the unique polar ecosystem and food web around the icy southern continent might respond to future climate change.
2025 Fenner Medal
Associate Professor Katherine Moseby, University New South Wales
Associate Professor Katherine Moseby is a conservation biologist who specialises in desert ecology. She researches ecosystem restoration and threatened species reintroductions. She is passionate about conducting research and applying the results to improve conservation outcomes. Her work includes co-founding four conservation research initiatives, and she partners with government, NGOs and industry groups to ensure her research is relevant, timely and has impact.
2025 Fenner Medal
Associate Professor Daniel Noble, Australian National University
Research findings are rapidly accumulating across science. This has caused a revolution in data synthesis (meta-analysis) driving evidence-based advancement of fundamental science, applied research and policy. Ecological data is especially challenging to handle because studies are highly variable (such as different species, ecosystems), but synthesis is essential to predict how climate change, invasive species and human activities affect biodiversity. Associate Professor Daniel Noble is spearheading global initiatives to improve biostatistical analyses of ecological and evolutionary studies. He has developed analytical approaches to deal with existing data; methods to estimate missing data; and user-friendly software for data extraction. His new tools are invaluable to biologists but are also used globally by scientists in fields as diverse as psychology and genetics. Associate Professor Noble is also an effective advocate for open and transparent science, reflected in his collaborative approach to research and his altruist service to the scientific community. This includes curating preprint archives, providing free software, and organising conferences and workshops.
2025 Gottschalk Medal
Associate Professor Amy Cain, Macquarie University
Antibiotic resistance is predicted to cause 10 million deaths per year by 2050 – more than all cancers combined. This is because our trusty miracle drugs – antibiotics – no longer work against deadly infectious bacteria. Shockingly, we have next to no new antibiotics in the discovery pipeline and a lack of financial incentives for pharmaceutical companies have left academics to drive development of these life-saving drugs. Associate Professor Amy Cain’s research bridges a key gap between finding promising drug targets in bacteria and developing potent new antibiotics. She is developing and applying new technologies to the most deadly hospital bacteria to build blueprints of how their genes adapt during treatment with existing antibiotics, revealing hidden weaknesses that can be targeted with new drugs. She has also established Australia’s first ‘Galleria Research Facility’, an ethical, high-throughput insect model. She uses this to screen drug effectiveness and toxicity, bringing promising new antibiotics closer to human use.
2025 Gottschalk Medal
Associate Professor Shom Goel, Peter MacCallum Cancer Centre
Associate Professor Shom Goel is an oncologist and scientist at the University of Melbourne and Peter MacCallum Cancer Centre. Over recent years, his laboratory research has sought to identify and understand treatments that block cancer cell division, with a focus on breast cancer. Through this work, he has made seminal discoveries that have changed the way we think about cancer cell division, cancer immunology, and cancer epigenetics. Importantly, these findings have led Associate Professor Goel to design novel therapeutic approaches for breast cancer and spearhead the translation of his findings into the clinic. The encouraging results from initial trials have triggered him to initiate two global studies that could change breast cancer treatment paradigms within the next 12 months. Importantly, the most recent lab discoveries from the Goel lab have further advanced thinking in this field and are driving the development of yet another generation of novel cancer therapies.
2025 John Booker Medal
Associate Professor Qianbing Zhang, Monash University
Assessing lifecycle performance is essential for the sustainability and resilience of infrastructure. It facilitates identification and mitigation of risks throughout all project stages, thereby ensuring infrastructure durability against various hazards. Associate Professor Qianbing Zhang has pioneered a systematic modelling platform for assessing infrastructure risks due to environmental changes, enhancing sustainability and resilience. His innovative framework integrates digitalisation, carbon assessment standards, numerical modelling and optimisation techniques to evaluate carbon emissions and establish benchmarks for construction practices. Additionally, he has developed technologies that improve safety and energy efficiency in mining operations. This platform utilises advanced data inputs and digital technologies to monitor infrastructure throughout its lifecycle. This allows managers to access real-time data for informed decision-making, ensuring safety and preventing failures. His platform is employed in significant projects such as Snowy 2.0 and Victoria’s North East Link, demonstrating its effectiveness in practical applications. His contributions are pivotal in advancing infrastructure safety and environmental management standards.
2025 Le Fèvre Medal
Dr Fengwang Li, University of Sydney
Dr Fengwang Li is a Senior Lecturer at the University of Sydney and a Flagship Program Lead at the ARC Centre of Excellence for Green Electrochemical Transformation of Carbon Dioxide, celebrated for his innovative contributions to sustainable chemistry. His pioneering work in CO2 electrolysis harnesses renewable energy to convert CO2 into ethylene, a key component in plastics, offering a groundbreaking solution to reduce greenhouse gas emissions. Dr Li’s research is particularly relevant as Australia grapples with the harsh realities of climate change. His discovery not only supports a circular economy by recycling carbon but also contributes to a net-zero emission future. His leadership in this field earned him the 2023 Eureka Prize for Outstanding Early Career Researcher. His work is a testament to the potential of electrochemistry to create valuable products from CO2, transforming the way we address climate change and supporting a sustainable economy and everyday life in Australia.
2025 Moran Medal
Professor Margarita Moreno-Betancur, Murdoch Children’s Research Institute and University of Melbourne
Contemporary health and medical research studies need statistical innovation to tackle important and increasingly complex questions concerning the causes of ill-health. Professor Margarita Moreno-Betancur’s research creates both new and improved biostatistical methods that enable novel and more accurate analyses of a wide range of data collected from people over time. These analyses can elucidate the complex causal pathways that lead to disease, for example through the interaction of multiple chronic conditions, and inform what types of interventions could prevent or cure ill-health while accounting for real-world data limitations and complexities such as missing data. Her work has powerful global reach beyond the field of biostatistics, via application of these methods in studies that advance knowledge in multiple health areas across many countries. Her methods have enabled the use of existing data resources to inform public policies, treatments and interventions for preventing cancer, cardiovascular disease, mental health disorders and allergy.
2025 Pawsey Medal
Associate Professor Claudia Lagos, University of Western Australia
Associate Professor Claudia Lagos is an exceptional researcher, internationally recognised for her expertise in galaxy formation and evolution. She has led and contributed to the development of a series of state-of-the-art theoretical tools to study galaxy formation and evolution which are at the forefront of the field. Dr Lagos has made use of her expertise and technical abilities to make groundbreaking contributions to the subject of the role of baryons (gas) in the evolution of galaxies, including its role in the chemical and angular momentum evolution of galaxies and in the promotion and suppression of the formation of stars.
2025 Pawsey Medal
Dr Daria Smirnova, Australian National University
Dr Daria Smirnova develops innovations at the nexus of fundamental physics of topological photonic phases and nanoscale material design towards nanodevices capable of high-speed and low-loss signal processing with light. Her approaches are rooted in engineering topological photonic states and their coupling with matter in judiciously structured materials at subwavelength scales. Such topological channels could serve as superhighways for photons and hybrid quasiparticles in nanophotonic circuits, thus being advantageous for encoding information, next-generation communication networks and quantum state engineering with topology-improved reliability and compactness. Dr Smirnova put forward new methods to probe and generate topological photonic states using radiative properties and optical nonlinearities in patterned photonic materials, in particular ultrathin nanostructured metasurfaces. The designed topological photonics architectures manipulate light-matter waves in an unusual way and prototype functional modules for high-performance computing, data protection, low-threshold nanolasers and lab-on-chip instruments to be integrated into microchips of everyday devices.
2025 Ruth Stephens Gani Medal
Dr Ira Deveson, Garvan Institute of Medical Research
Dr Ira Deveson leads a research group using new genomic technologies to improve the diagnosis of genetic disease. His work spans from basic methods development to large-scale genomic analysis of diverse human cohorts. His goals are to develop, adopt, optimise and validate new techniques that may shed new light on the genome, show how these can be used to address unsolved challenges in genomic medicine and facilitate their eventual translation into clinical practice. Dr Deveson’s team has led the adoption of new technologies for long-read DNA sequencing (LRS) in Australia, allowing us to resolve the most complex, repetitive regions of the human genome for the first time, and to reliably identify new classes of genetic variation that are difficult to identify with existing technologies. By generating a more complete snapshot of a patient’s genome, his team is applying LRS to improve our understanding and diagnosis of inherited disease.
TMIA results and resources
Activities supported by the Theo Murphy (Australia) Fund from 2008 to 2024
Highlights of outcomes from 2022–23 activities
Two Flagship activities ($65,000), 12 Amplify initiatives ($136,800) and 10 Participation Support grants ($26,425) were supported during the 2022–23 grant round. The 2022-23 program had the following outcomes:
-
Over 900 EMCRs from 37 universities and institutions across Australia benefited from TMIA grants.
-
ECMRs and grantee organisations were able to make linkages with 23 industry partners, and conduct or attend 24 symposiums and conferences, some of which were very critical for research endeavours.
-
Participation support grants enabled six EMCRs to travel to New Zealand, China and the United States for research presentations and conferences.
-
People engaged in activities included Aboriginal women, queer individuals, lecturers, senior scientists, research fellows, policymakers, post-doctoral researchers, health professionals, women in STEM, the Academy’s National Committees for Science members, and industry partners.
-
Thematically, the activities were in the areas of water and river care, queerness in STEM, dementia, circular bioeconomy, mentorship, nutrition, omics and bioinformatics, observational data, sleep research, translational research, purification technology, chemosensory testing, gastroenterology, and cardiovascular rehabilitation.
Apart from TMIA grant funding, the initiatives secured additional support, both financial and in kind, from 19 partners, maximising impact and expanding EMCR networks. In some projects, minimal event registration fees were applied to supplement the event budget.

Flagship activities
Fostering cross-cultural women’s knowledge on Water and River Country
Delivered from 19 to 23 February 2024 in Tasmania, the symposium titled ‘tunapri luna: women’s knowledge, freshwater and sea country connections from Lutruwita to Martuwarra’ brought together 35 Aboriginal women (30 from Lutruwita and five from Martuwarra) to celebrate Aboriginal women’s ways of knowing and healing our waterways.
Subsequently, a symposium was attended by 80 Aboriginal and non-Aboriginal women who share an interest in understanding and healing our waterways. The symposium included films from Lutruwita and the Martuwarra River, keynote talks, a musical performance, presentations on restoration projects being undertaken by Pakana rangers, and panel discussions on Aboriginal water sovereignty, cultural engagement, healing and impacts of climate change. Attendees also participated in cultural activities such as shell stringing and making kelp water carriers. The event highlights were captured in the Academy’s newsletter.
The history of queerness in STEMM
Researchers from Monash University worked on uncovering the historical contributions of queer individuals in STEMM fields in Australia (STEMM is an alternative way of writing STEM and stands for science, technology, engineering, mathematics and medicine). Through archival research and presentations at conferences and events like the LGBTQIA+ STEMM Day celebration, which was attended by over 65 EMCRs, the project highlighted the often-overlooked achievements of queer individuals. The research findings were presented at conferences and published in the conference proceedings. The initiative also included community engagement activities such as the presentation of awards and personal testimonies, aiming to foster a supportive environment for LGBTQIA+ individuals in STEMM and gather feedback for future initiatives.
Amplify activities
Dementia Australia Workshop for EMCRs
This event enabled networking between two academics, five EMCRs, and eight health care professionals and their relevant service stakeholders, to encourage future research collaborations in ageing, dementia and virtual reality education. Participants were from a range of backgrounds including physiotherapy, education, neuropsychology, occupational therapy and medicine.
Prosper! Interdisciplinary Solutions to Prosperous Regions
This conference provided an opportunity for 11 EMCRs from STEM, creative education and businesses from South Australian (SA) and interstate universities to participate in roundtable discussions with 13 regional leaders and eight senior academics to highlight their research and identify research areas relevant to SA regions. The roundtable discussions centred around sustainability, liveability, education, regional resilience, and attraction of companies.
Partnering with EMCRs for Innovation and Impact: 2023 Circular Bioeconomy in a Decarbonised World Symposium
This event enabled EMCRs, academic researchers, post-doctoral fellows and students to participate in discussions for the implementation of circular bioeconomy and decarbonisation strategies and policies. The experts represented both government and private organisations, discussing science, environmental sustainability, engineering, economics, policy making and the circular bioeconomy. Fifty EMCRs were able to network with potential industry partners and engage in discussions that would lead to wider opportunities and future collaborations. An e-learning product has been created on Google Classroom for researchers working on the circular bioeconomy and net zero emissions.
Making Meaningful Mentorships – An EMCR Program
Planning, mentoring and networking has been identified as one of the challenges faced by EMCRs, and this initiative helped design mentorship resources to facilitate networking between EMCR and senior researchers. Through the initiative, the project team developed the ‘Making Meaningful Mentorship’ program and toolkit aimed at helping over 1,000 EMCRs from three Western Australian universities.
Supercharge Your CV and Promotion Application
This initiative enabled women in STEM to participate in the art and science of writing curriculum vitae and identification of entry points for their next career stage. Two workshops were hosted at the Academy EMCR Forum Science Pathways Festival 2023, with over 100 EMCRs participating. The workshop provided a promotional opportunity for WOMESSA, leading to a partnership agreement with the Geological Society of Australia to co-develop future EMCR career development events.
Supporting EMCR Leadership in the Implementation of the Nourishing Australia Decadal Plan for the Science of Nutrition
This symposium brought together 50 EMCRs in nutrition and dietetics with 20 members from the National Committee for Nutrition and other symposia presenters to strategise the implementation of four key recommendations from the Nourishing Australia decadal plan. The symposium provided EMCRs with the specifics of the decadal plan’s pillars and the opportunity to play a role in the implementation of the plan’s recommendations.
Summary report from the 2017 Theo Murphy High Flyers Think Tank ‘Rethinking Food and Nutrition Science’
Australian Omics and Bioinformatics EMCR Symposium
This symposium gathered EMCRs from mass spectrometry omics related fields including proteomics, metabolomics and lipidomics. Travel grants enabled EMCR’s to present their work to over 170 event participations from Victoria, New South Wales, South Australia and Queensland.
Southern Ocean Observing System (SOOS) Symposium 2023: Creating Impact for your Observational Data Beyond Research
This symposium focused on unlocking the potential of observational data provided 40 EMCRs with the opportunity to enhance their ability to incorporate observational data into all aspects of research and communication. Through networking, the event created a community of ECMRs in observational data and use of data beyond research.
Third Biennial Meeting of AusInterPore
This conference attracted over 50 EMCRs from Australian universities, research organisations and industry partners to attend a conference featuring presentations on digital rock, groundwater, and mineral recovery. It was followed by poster presentations, with the winner presenting on the application of porous media methods for fuel cell analysis.
Building a NEST: Bringing Together and Empowering Sleep Researchers in Training
This event provided over 60 EMCRs with the opportunity to engage in discussions on sleep health, sleep medicine, sleep disorders and sleep technology. The initiative also provided professional development opportunities, fostering interdisciplinary collaboration in sleep research. Over 1,000 attendees participated in the Sleep DownUnder event including medical practitioners, exercise scientists, pharmacists, dentists, physiologists, sociologists and anthropologists.
Westmead Research Hub EMCR Symposium
This symposium provided 119 EMCRs from the University of Sydney, CSIRO, Children’s Medical Research Institute, Kids Research, Westmead Institute for Medical Research, and Western Sydney Local Health District to enhance knowledge on research development by engaging with keynote speakers and networking with more researchers to work on impactful projects. As a result, the EMCRs had the opportunity to build networks and collaborations across the organisations, win travel awards to attend national and international conferences and develop track records by presenting their research.
Inspiring EMCRs towards Translational Research and Mobility Grant Application
This event was an add-on EMCR program to the third Australian Symposium on Advances in Separation Science. It featured an industry–researcher engagement session focused on translational research and industry-oriented career paths for EMCRs. Attended by 46 EMCRs, 35 industry experts and 14 academics, the symposium provided the opportunity for more than half the EMCRs attending to present their work and receive peer, industry partner and academic feedback. The project provided travel grants to 8 EMCRs attending the event.
Participation Support grants
Ten EMCRs (four male and six female) attended conferences and symposia in Australia (4), New Zealand (3), the United States (2) and China (1). Fields of research included chemical and environmental engineering, gastroenterology, nutrition science, genetic epidemiology, diet interventions for gut and mental disorders, and cardiovascular rehabilitation. The recipients came from six institutions in Victoria, two in NSW, one in Queensland and one in South Australia.
Activities funded 2017-22
- EMCR brain science network
- Research data science winter school
- Collaboration across boundaries 2018
- Cooling Sydney hack
- 2018 cutaneous biology meeting
- Transferable skills for EMCRs
- Mentoring and guidance in careers (MAGIC) workshop
- International conference for youngr Rresearchers on advanced materials emerging researchers mobility grant application
- Theo Murphy Initiative delivers opportunities for early- and mid-career researchers
- Empowering regional research
- Genomes and biodiversity: research and career development workshop
- Re:produce workshop
- Synthetic Biology Australasia 2019 conference
- STEM transferable skills toolkit
- EMCRs gain skills to build successful careers
- EMCR citizen science panel discussion
- The importance of citizen science and longevity of data and the future of citizen science
- Australian Citizen Science Association EMCR Working Group
- Catalysing Australia–Japan science and innovation
- Citizen science and leadership training among events to inspire and support EMCRs
- Reboot STEMM: re-defining academic “success” for a more inclusive STEM sector
- Conversation in Science
- Connecting the dots: knowledge brokering for impact and innovation
- Flourish! Interdisciplinary solutions for a thriving planet
- Science for the Public Good
- Theo Murphy Initiative (Australia) – Online FAQ (Frequently Asked Questions) Session
High Flyer Think Tank events 2008–17
- Agricultural productivity and climate change
- Searching the deep earth: the future of Australian resource discovery and utilisation
- Stressed ecosystems: better decisions for Australia’s future
- Australia's population: shaping a vision for our future
- Inspiring smarter brain research in Australia
- Climate change challenges to health
- The stem cell revolution: lessons and imperatives for Australia
- An interdisciplinary approach to living in a risky world
- Rethinking food and nutrition science
Frontiers of Science events 2010–19
- Frontiers of marine science
- Science for a green economy
- The edges of astronomy
- Materials for the 21st century: from design to application
- The microbiome: exploring the role of microorganisms in ecosystem processes and health
- The Antarctic frontier: developing research in an extreme environment
- Frontiers of Science—redefining healthy ageing together
Global Talent Attraction Program – Candidate Merit Pool FAQs
This page was updated on 17 June 2025
The information below is updated regularly to reflect common queries about the Global Talent Attraction Program (GTAP) Candidate Merit Pool (CMP).
The GTAP CMP FAQ web page provides answers to common queries about Round 1 of the program, including applicant eligibility, assessment processes and general program queries. While we aim to provide additional guidance here, all applicants must refer to the program guidelines for full program conditions.
For any program queries or further assistance, contact the program team at gtap@science.org.au.
FAQs
Am I eligible to apply if I already hold Australian citizenship or permanent residency?
Yes, Australian citizens and permanent residents are welcome to apply for the candidate merit pool, should they meet all other application requirements.
Can I submit the application myself, or must I be nominated?
Applicants are to submit their own application and include a support letter from an Australian Academy of Science Fellow sponsoring the application.
What does the Candidate Merit Pool application assessment process involve?
All complete applications are screened for eligibility and then merit assessed by a panel of Scientific Expert Assessors against the published assessment criteria outlined on the GTAP Candidate Merit Pool web page.
Will I receive feedback if I am not selected for the merit pool?
No. The Academy does not provide individual feedback on outcomes.
Can I update my application or supporting documents after submission?
No. Applications must be complete at time of submission. Incomplete applications are ineligible and will not progress for consideration.
Do I need to secure a role or engagement in Australia before applying?
No. The Candidate Merit Pool will identify high-calibre candidates who wish to formally register their interest in relocating to Australia. Being accepted into the pool does not guarantee a funded position or impact visa application processing.
Do I need supporting referee reports as part of my application?
Yes. Two support letters are required, and at least one must be from an independent referee at an international institution outside both Australia and your home institution.
What kind of achievements are considered ‘exceptional’ or ‘outstanding’?
Examples include international top-of-field awards, recent publications in top-ranked journals, such as Nature, Lancet or Acta Numerica, or sector-defining innovation with measurable impact.
How is my application judged for career stage or sustained trajectory?
Assessors will review your responses to the application form questions, your track record, leadership roles, and research outputs for evidence of an established and sustained trajectory, and assess your application against the criteria outlined on the GTAP Candidate Merit Pool web page.
What happens once I am accepted into the candidate merit pool?
You will be notified of your acceptance and asked to approve a candidate profile for use in discussions with relevant stakeholders or prospective partner institutions.
Does being selected guarantee that I will receive a funded role or offer?
No. Acceptance into the merit pool does not guarantee a funded position or engagement. It confirms your eligibility and suitability under the defined criteria.
Can I withdraw from the merit pool at any time?
Yes. You can withdraw your consent or request your profile be removed at any time by contacting the Academy.
Is there a time limit on how long I can remain in the candidate merit pool?
Candidates typically remain in the pool for a set period (e.g. 12 months), after which a review may be conducted. Specific details will be outlined at the time of acceptance.
Who will contact me if a suitable opportunity arises?
The Academy is the contact point for all candidate enquiries and will engage with candidates if an opportunity aligns with your expertise and interests.
Science on the campaign trail
There is a lot said during an election campaign – and much of it highlights why science matters.
In the 2025 election, we’re outlining on social media how so many campaign remarks and election commitments rely on science. Politicians talk about and rely on science every day, they just use different words.
Follow the campaign and share the content via these channels
Facebook | LinkedIn | Instagram | Threads | X
The Academy’s election focus
Find out about the Academy’s proposal for a 10-year plan to meet Australia’s future supercomputing needs.
The future of generative AI
On the campaign trail, Prime Minister The Hon Anthony Albanese MP said:
The biggest transformation, perhaps, that's happening since the industrial revolution is going on now is the transformation to a clean energy, net zero economy by 2050.
Science is re-imagining how we source and use energy – from green steel to solar breakthroughs – laying the path to net zero. A cleaner energy future built on Australian smarts.
The future of generative AI
Senator Jacquie Lambie commented on the power of artificial intelligence while on the campaign trail, after hearing her own AI-generated voice clone.
Powered by decades of science, from computing and mathematics to neuroscience and linguistics, generative AI could add up to $115 billion a year to Australia’s economy by 2030.
Science solutions to invasive species
On the campaign trail, David Pocock, Independent Senator for the ACT, highlighted the cost of invasive species and the potential of gene editing solutions.
Australian researchers are using powerful gene editing tools like CRISPR-Cas9, which draw on core scientific ideas from molecular biology, genetics, ecology, and evolutionary biology to combat Australia’s invasive species crises.
Defence systems of the future
The Hon Andrew Hastie MP, Shadow Minister for Defence, said:
We are facing the most dangerous strategic circumstances since the end of the Second World War.
Science is helping build the defence systems of the future – like the ‘Ghost Shark’, a new underwater drone designed to patrol Australia’s oceans, gather intelligence, and spot threats before they reach us.
A strong STEM education pipeline benefits Australia
The Hon Ed Husic MP, Minister for Industry & Science, spoke in support of STEM education for Australia's future.
Australia's research workforce contributes $185 billion per year to the economy and supports 1.2 million jobs. A robust, diverse and equitable STEM education pipeline is essential to enabling and growing this critical element of the economy.
Evidence-informed climate policy
On the campaign trail, Opposition Leader The Hon Peter Dutton MP said:
I don't know because I'm not a scientist and I can't tell you whether the temperature has risen in Thargomindah because of climate change or the water levels are up.
Scientific research on global temperature trends, greenhouse gas emissions, and shifting weather patterns ensures governments can confidently make climate policy decisions informed by the best available scientific evidence.
Good nutrition for Australian kids
Mr Max Chandler-Mather MP noted the impact of quality nutrition on children's learning on the campaign trail.
Australian nutrition science has shown that what kids eat can shape how they think, behave and learn. Better diets support brain development, improve concentration in class, and strengthen the immune system.
Climate change impacts on housing
On the campaign trail, Senator Mehreen Faruqi discussed how climate change will impact homes.
Under some projected climate change scenarios, 1 in every 19 property owners face the prospect of insurance premiums that will be effectively unaffordable by 2030. Three degrees of global warming would make many more properties and businesses uninsurable.
The invention of an Australian icon
Prime Minister The Hon Anthony Albanese MP confirmed that he's a Vegemite fan on the campaign trail, after lobbying Canadian authorities to reverse an initial ruling that the spread did not meet local food regulations around vitamin fortification.
The invention of Vegemite over 100 years ago highlights Australia's long history of innovation. After WWI disrupted Australian Marmite imports, chemist Cyril Callister developed the iconic spread using brewer's yeast and vegetable extracts.
Robust information for emergency management
Senator the Hon Jenny McAllister, Minister for Emergency Management, highlighted that good information is critical for responding to an emergency on the campaign trail.
Australia’s ability to predict extreme weather events and reduce our vulnerability relies on emergency management decisions grounded in high quality climate modelling and timely weather tracking.
Technological solutions for multiple crises
We already have solutions to big challenges facing our society, Greens Leader Adam Bandt said on the campaign trail.
Science and technology are helping Australians deal with major challenges like floods, rising housing costs, and climate change. From predicting disasters to building safer, more affordable homes, science is shaping a better future for all of us.
Safeguarding the Great Barrier Reef for the future
On the campaign trail, Prime Minister The Hon Anthony Albanese MP called the Great Barrier Reef an economic powerhouse and an environmental asset.
The Great Barrier Reef is a natural wonder of the world, home to about 10 per cent of the world’s coral reef ecosystems. And Australian scientists are working hard to sustain it for future generations to enjoy – from creating new tools to spot early signs of coral bleaching to building the reef’s resilience to climate change.
Critical minerals – critical science
Critical minerals play a vital role in Australia’s export sector. Prime Minister The Hon Anthony Albanese MP said his government plans to:
transform Australia into a major player in the global critical minerals market.
Australian science is the key to boosting the critical minerals industry and creating efficiencies. For example, techniques like remote sensing help detect mineral signatures under Australia’s surface without the need to dig.
Science nourishing food security
The Australian agriculture industry is the envy of the world. In the campaign trail, Opposition Leader The Hon Peter Dutton MP emphasised that as a small nation, our food production outweighs domestic need.
Australian science plays and will continue to play a significant role in this industry. Research into climate-resilient wheat, ‘green’ ammonia, and Omega-3 canola are some of the many ways science has contributed to nutritious products and sustainable farming practices.
Solar panels powered by science
Renewal energy is a hot topic in this election. Prime Minister The Hon Anthony Albanese MP said:
One in three Australian households now have solar – but only one in forty households have a battery.
Australian science brought you solar panels that power homes across Australia and keep electricity prices down. Now Australian science has revolutionised battery technology with Zinc-bromide batteries that are perfect for harsh climates in regional Australia. Even better: they can be recycled.
Australia’s biosecurity system – a global competitor
On the campaign trail, Prime Minister The Hon Anthony Albanese MP and Opposition Leader The Hon Peter Dutton MP agreed that Australia’s biosecurity system is one of national significance and cannot be undermined or compromised.
This is not based on luck. Australia has one of the strongest biosecurity systems globally, and we have Australian science to thank for it.
Highlights from Science at the Shine Dome 2024
Welcome to our highlights from Science at the Shine Dome 2024.
The event is a hybrid format, so audiences were able to join us in person in Canberra or from anywhere in the world, online.
Science at the Shine Dome is the Academy’s flagship event. Over four days, Australia’s most influential scientists gather at the Shine Dome in Canberra to celebrate and honour outstanding achievements in science.
It enables researchers from all disciplines and career levels to come together to present, share, network and collaborate.
We are grateful to our generous event partners, who made this event possible.
This year, Fellows elected in 2023 and 2024 and award recipients from 2023 and 2024 were all recognised across the event.
The event also celebrates the Academy’s 70th anniversary. Find out about our event artwork.
Watch the highlights of Science at the Shine Dome 2024
On this page
Handy links
- Watch the livestreams
- Read the event program
- Visit the event website
- Follow the action on X (formerly Twitter): #ShineDome24 and Academy.
Related web reports
- President’s address and launch of Academy Innovate Reconciliation Action Plan
- Transcript: Science at the Shine Dome 2024 Gala Dinner speech
Day 4: Thursday 12 September
On Thursday, attendees were still buzzing after the activities at the Gala Dinner the night before.
What a wonderful evening at @Science_Academy gala dinner as a part of #ShineDome24 with Her excellency @gg_australia , minister Husic , president of The Academy! pic.twitter.com/yS7HvKwH2A
— Prof Brajesh Singh (@Prof_Braj_Singh) September 11, 2024
Healing Water Country, virtual neighbourhoods to protect plants, and the chemistry of natural dyes
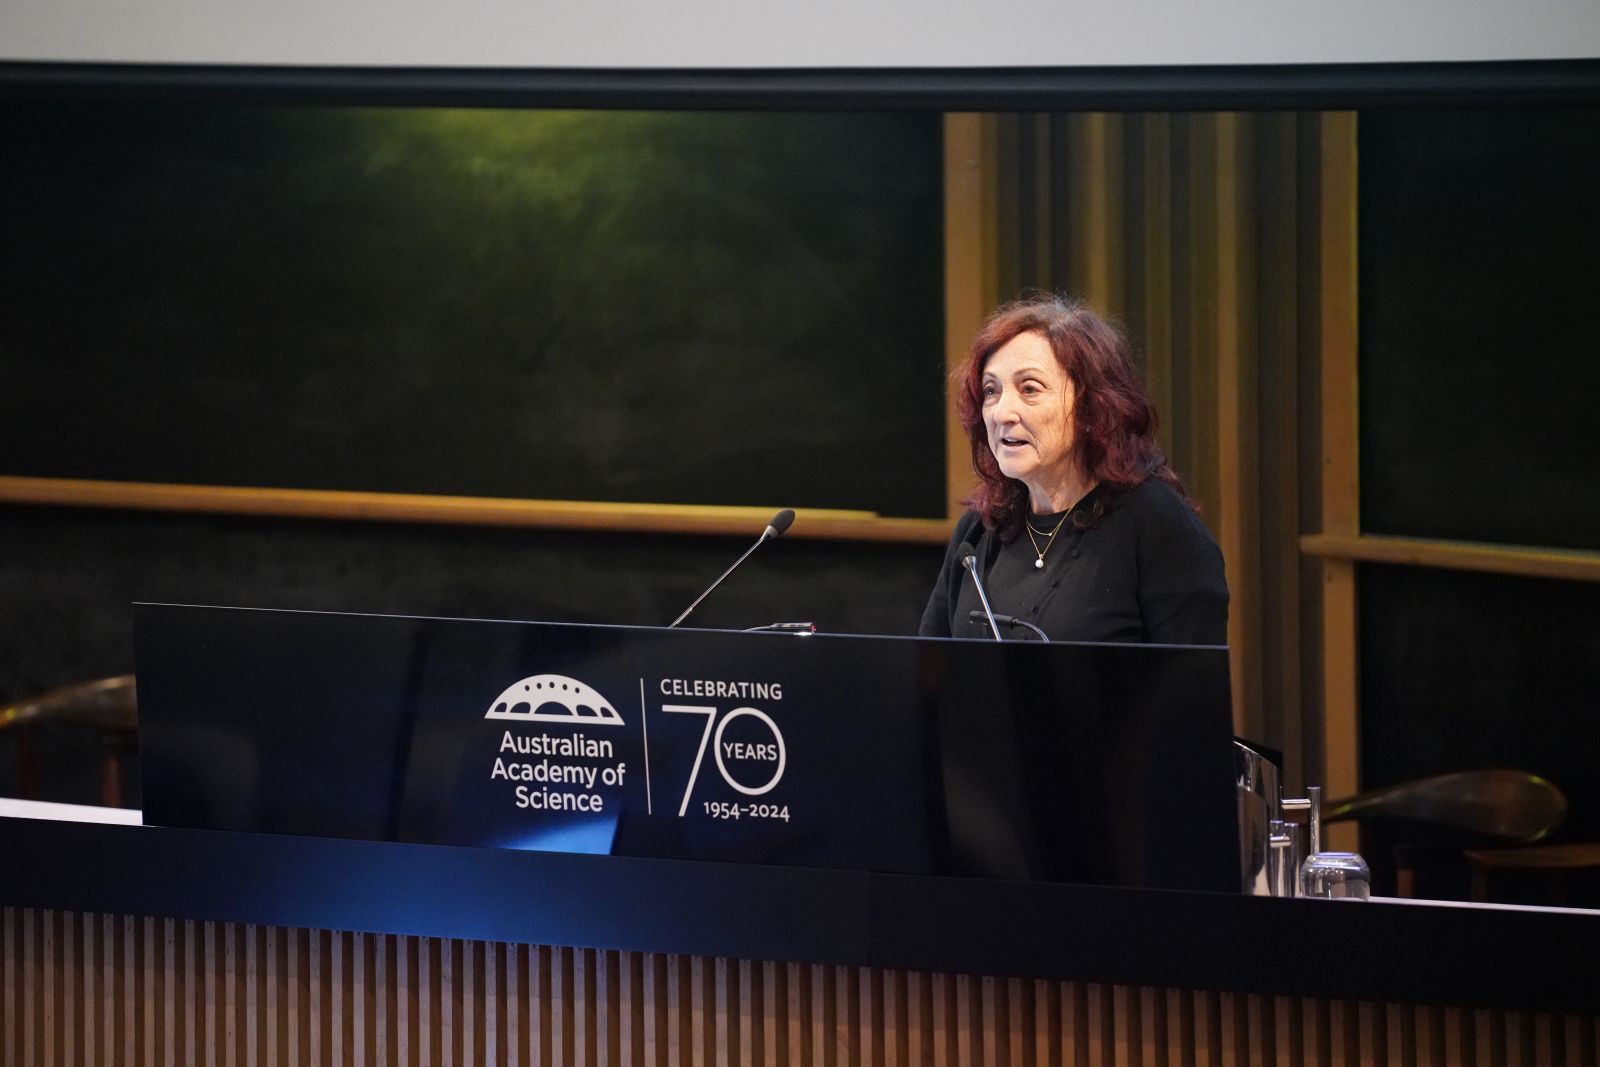
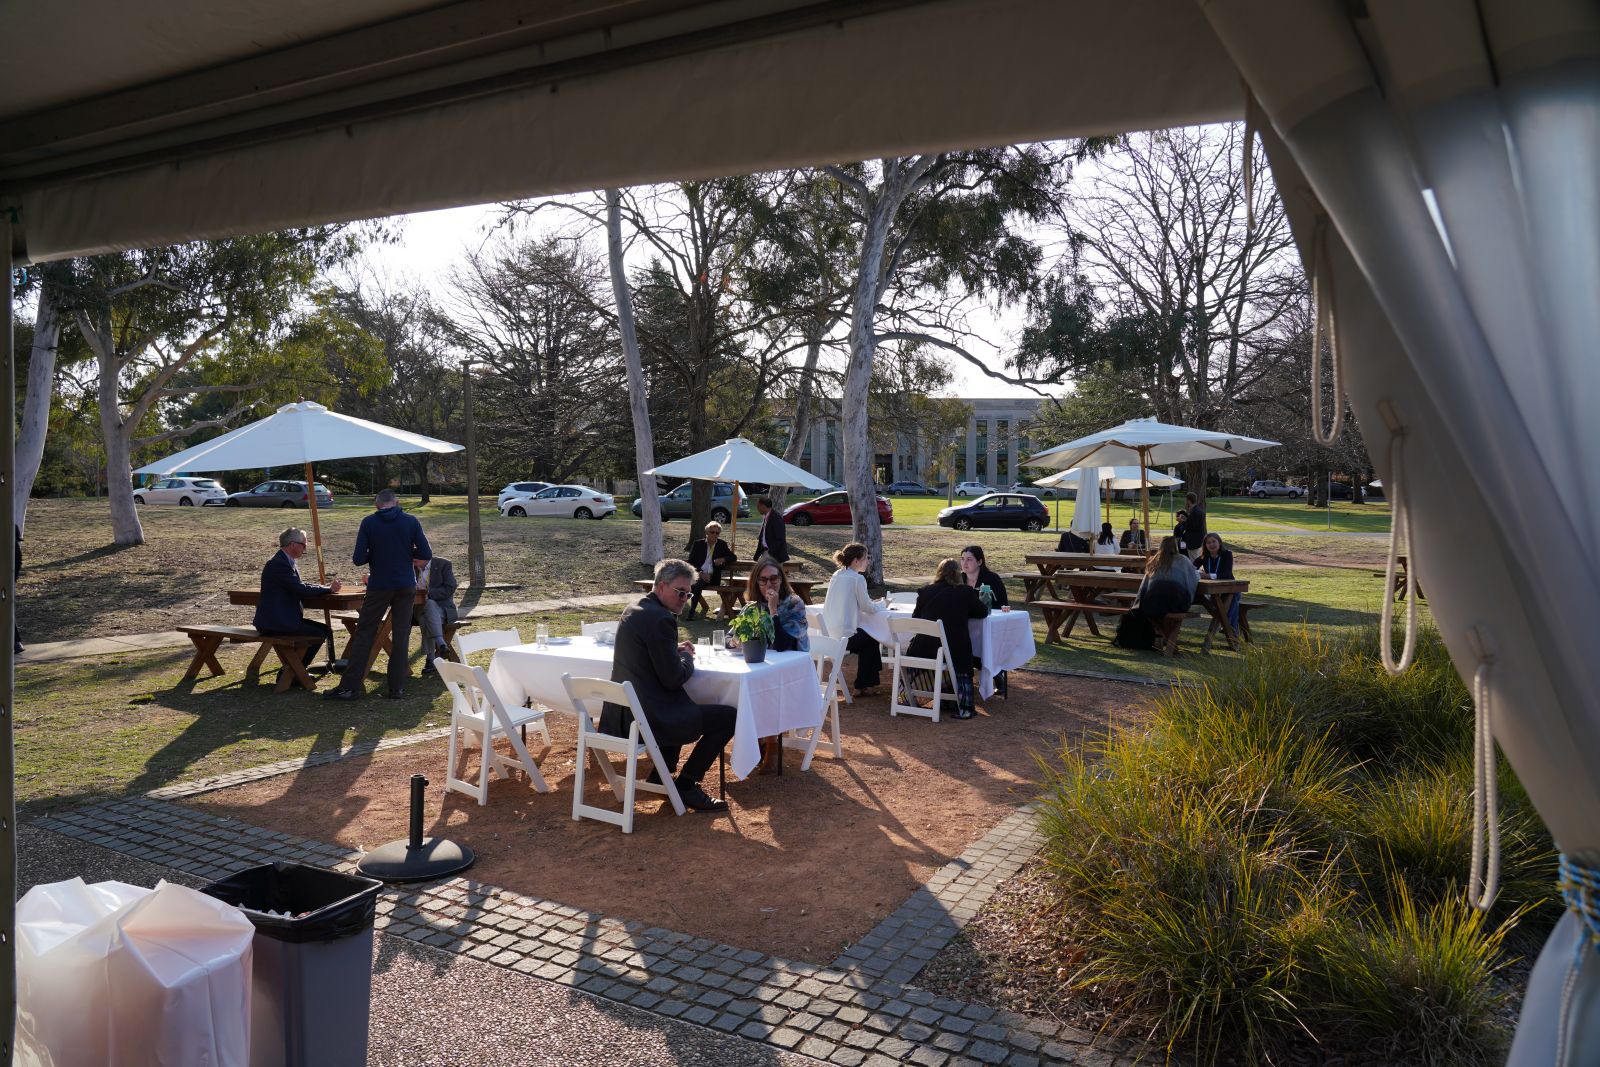
The final day of Science at the Shine Dome 2024 began bright and early with a breakfast for awardees, supporters and donors in a marquee outside Ian Potter House.
Stephanie Beaupark of the University of Wollongong and Michelle Hobbs of Griffith University were awarded the 2023 Aboriginal and Torres Strait Islander Scientist Award.
Dr Patrick Finnerty of University of Sydney and Mr Shawn Scott of the University of South Australia were awarded the 2023 Max Day Environmental Science Fellowship Award.
Dr Justine Clark of the Telethon Kids Institute and Dr Joe Greet of the University of Melbourne were awarded the 2024 Aboriginal and Torres Strait Islander Scientist Award.
Aviya Naccarella of Deakin University and Dr Elvis Okoffo of the University of Queensland were awarded the 2024 Max Day Environmental Science Fellowship Award.
Christopher Keneally of the University of Adelaide and Dr Jiaying Li of the University of Sydney were highly commended.
Read more about the Academy’s awards and opportunities.
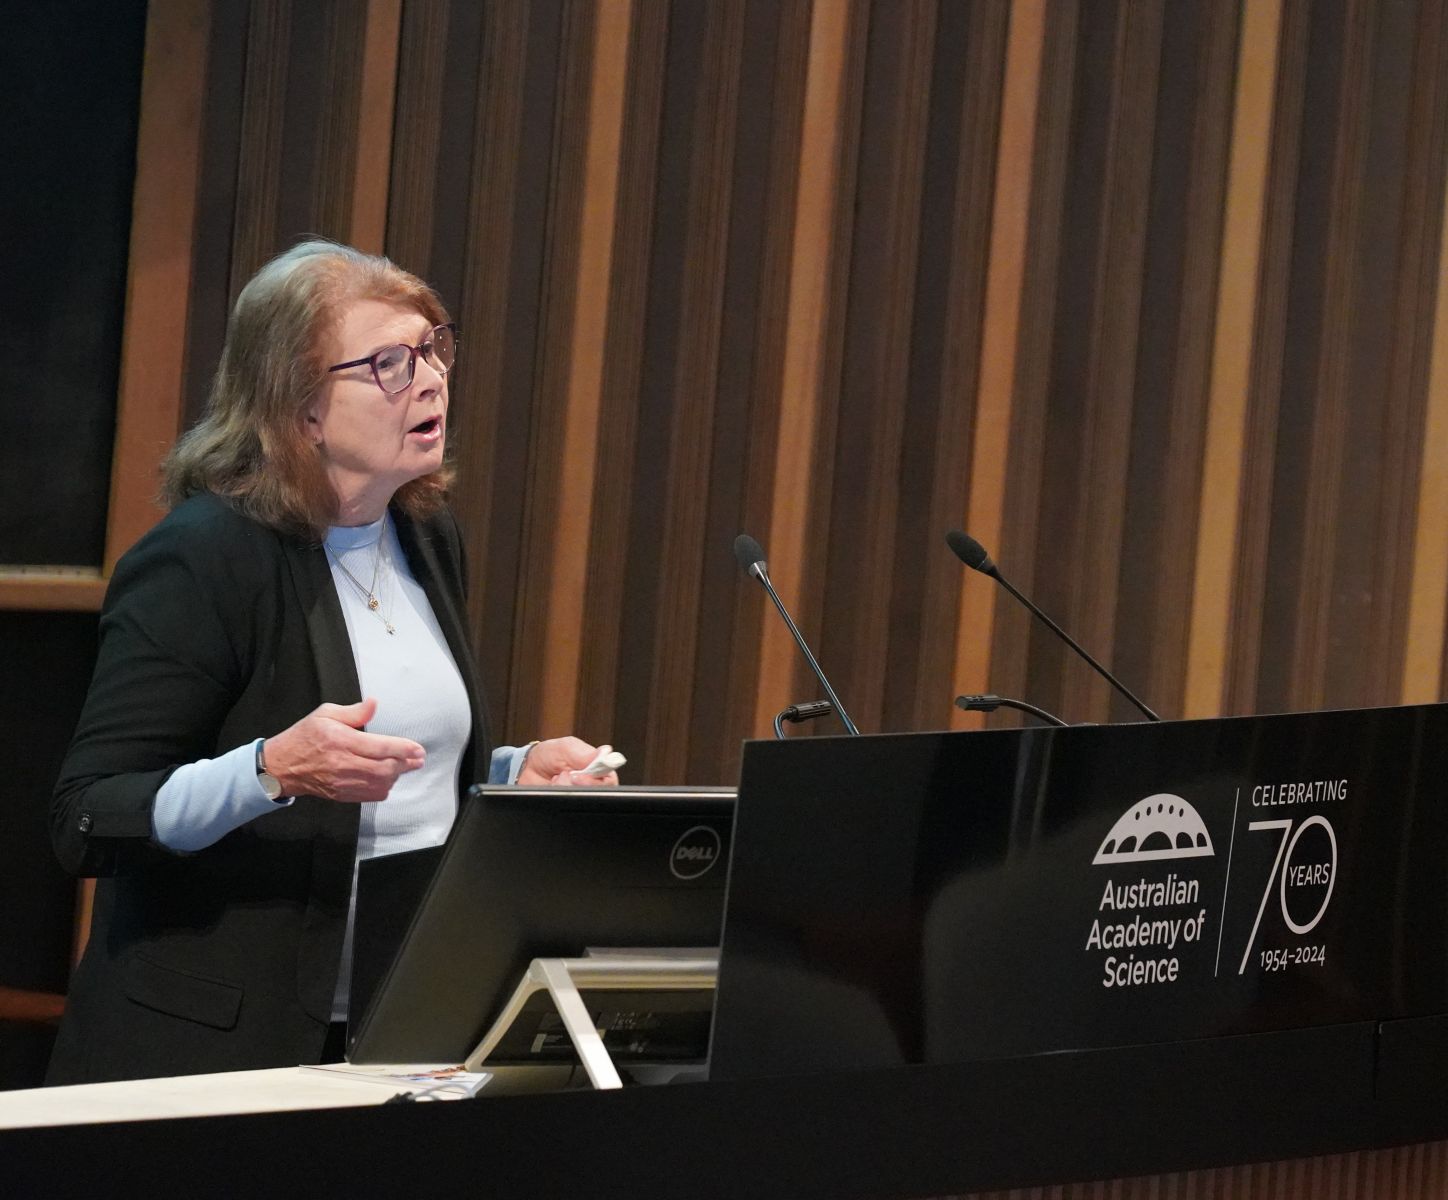
Over at the Shine Dome, the theme of awardees continued, with Professor Lidia Morawska FAA presenting the 2023 Matthew Flinders Lecture on her research in indoor air quality.
Professor Morawska related the story of how at the beginning of the Covid-19 pandemic, authorities were buying—en masse—purifiers and delivering them to schools.
“I said, ‘They will become electronic junk.’ Because schoolteachers, principals, they didn’t know what to do with them. And that came to be,” Professor Morawska said.
“Yes, they are effective but still, some knowledge of how to use it, and some autonomous operating, is necessary.”
Professor Jenny Graves AC FAA then delivered the 2023 Ruby Payne-Scott Lecture, observing that alligators are the “pin-ups” of environmental sex determination.
“When it’s hot, the eggs all hatch as males; when it’s cold, they all hatch as females. Same eggs but a different trigger pointing them down a different pathway,” she said.
Awardees then had the opportunity to have professional portraits and group photos taken.
Next, Professor Di Yu FAHMS, recipient of the 2023 Jaques Miller Medal, described his research into the essential assistance that T cells provide other immune cells.
This was followed by further award and medal presentations:
- 2023 Nancy Millis Medal Awardee Presentation: Professor Renae Ryan
- David Craig Medal 2023: Professor David Craik AO FAA FRS
- Hannan Medal 2023: Professor Richard Hartley FAA FRS (not in attendance)
- Jaeger Medal 2023: Professor Matthew England FAA
- Suzanne Cory Medal 2023: Professor Terry Hughes FAA and Professor Catherine Lovelock FAA (not in attendance)
- Thomas Ranken Lyle Medal 2023: Professor Susan Scott FAA and Professor Nick Wormald FAA
- Anton Hales Medal 2023: Associate Professor Teresa Ubide
- Christopher Heyde Medal 2023: Dr Valentina Wheeler
- Dorothy Hill Medal 2023: Associate Professor Raffaella Demichelis
- Fenner Medal 2023: Associate Professor Emily Wong
- Gottshalk Medal 2022: Dr Alisa Glukhova
- Gottshalk Medal 2023: Professor Si Ming Man
- John Booker Medal 2023: Dr Amelia Liu
- Le Fèvre Medal 2023: Associate Professor Rona Chandrawati and Professor Tianyi Ma
- Moran Medal 2023: Professor David Frazier and Dr Rachel Wang
- Pawsey Medal 2023: Professor Yuerui Lu
Global control of neglected tropical diseases, next-generation solar cells, and flammability in forests
After a break for lunch and more opportunities for professional photos and networking, Professor David Lindenmayer AO FAA gave the 2024 Macfarlane Burnet Lecture, on feedbacks and disturbance-stimulated flammability in forests.
“There’s no doubt that long-term climate and short-term weather are key drivers of fire.”
Professor Lindenmayer said during his lecture.
This was followed by the 2024 Ruby Payne-Scott Lecture, on Bayesian statistical science in the 2020s, presented by Professor Kerrie Mengersen FAA FASSA, who claimed that "The 2020s is an amazing time to be a statistician."
The following 2024 awardees then had 10 minutes to give presentations on their research, followed by an opportunity for Q&A with the audience:
- 2024 David Craig Medal Awardee Presentation: Professor Justin Gooding FAA FTSE
- 2024 Suzanne Cory Awardee Presentation: Professor Peter Koopman FAA
- 2024 Nancy Millis Awardee Presentation: Professor Anita Ho-Baillie
- 2024 Gustav Nossal Medal Awardee Presentation: Professor Andrew Steer FAHMS
This was followed by medal presentations:
- Mawson Medal 2024: Dr Adriana Dutkiewicz
- Anton Hales Medal 2024: Dr Andrew King
- Christopher Heyde Medal 2024: Professor Serena Dipierro and Dr Christopher Lustri
- Dorothy Hill Medal 2024: Associate Professor Ailie Gallant
- Fenner Medal 2024: Associate Professor Ana Martins Sequeira
- Frederick White Medal 2024: Dr Hamish Clarke
- Gottschalk Medal 2024: Professor Eric Chow and Associate Professor Kirsty Short
- John Booker Medal 2024: Associate Professor Lining Arnold Ju
- Le Fèvre Medal 2024: Professor Yao Zheng
- Pawsey Medal 2024: Professor Jiajia Zhou
- Ruth Stephens Gani Medal 2024: Dr Sonia Shah and Dr Stephin Vervoort.
That’s a wrap, folks!
Academy Chief Executive Anna-Maria Arabia, and Academy President Professor Jagadish delivered closing remarks, thanking the event partners, the Academy Executive Committee and Council, as well as the Secretariat for their work in bringing Science at the Shine Dome together.
Day 3: Wednesday 11 September
Wednesday morning’s activities were kick-started with the Platinum Event Partner Address by Academy Fellow Professor Tanya Monro AC FAA FTSE of the Department of Defence.
Professor Monro highlighted the role science can play as a deterrent to conflict.
“Through science we can make sure that our smaller nation, with vast territories to protect, can keep this region peaceful and keep our men and women out of conflict,” she said.
From microbes to back pain and a journey to the centre of the Earth: 2024 Fellows
The Fellows elected in 2024 then began their presentations, beginning with Professor Nerilie Abram FAA.
She described how her research uses the natural archives preserved in the Earth—from layers of ancient snowfall in Antarctica to the growth of coral skeletons in tropical waters.
Bringing this information from around the world together to build open access databases, they gain a unique perspective on the recent human-caused climate warming.
For example, when looking at 2019, Australia’s hottest and driest year on record, the positive Indian Ocean Dipole event was the strongest in our observational record—but our records are short, she noted.
That year was also the last of a three-year Tinderbox Drought, which was unforeseeable based purely on the observational record.
“We can use climate model simulations of the last millennium to go even further back in time and to have multiple realisations of climate variability. When we do that, what we find is that even without human-caused climate change, it’s possible in Australia to have droughts that don’t break for more than 20 years,” Professor Abram said.
“That’s something quite unimaginable compared to the droughts that we’ve lived through since the 1900s, and adds a sense of urgency to how we prepare Australia for extremes like this, particularly in a changing climate.”
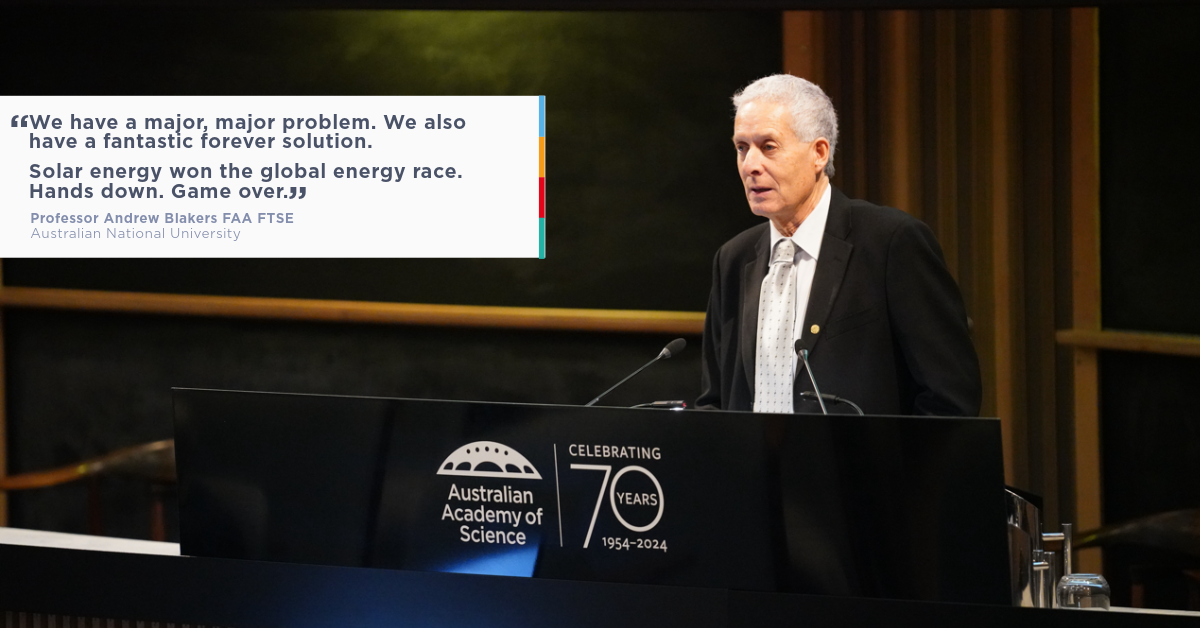
Professor Andrew Blakers FAA FTSE then spoke about the exponential growth of solar, and his hopes for the role renewables will have in the future.
He was followed by Professor Rachelle Buchbinder AO FAA FAHMS who shared her landmark investigations into the efficacy (and sometimes, harms) of various interventions for musculoskeletal problems and chronic pain management.
Professor Kylie Catchpole FAA FTSE shared how she teaches students to use their strengths and interests when it comes to action on climate change, noting, “Optimism is justified. Optimism is also generative.”
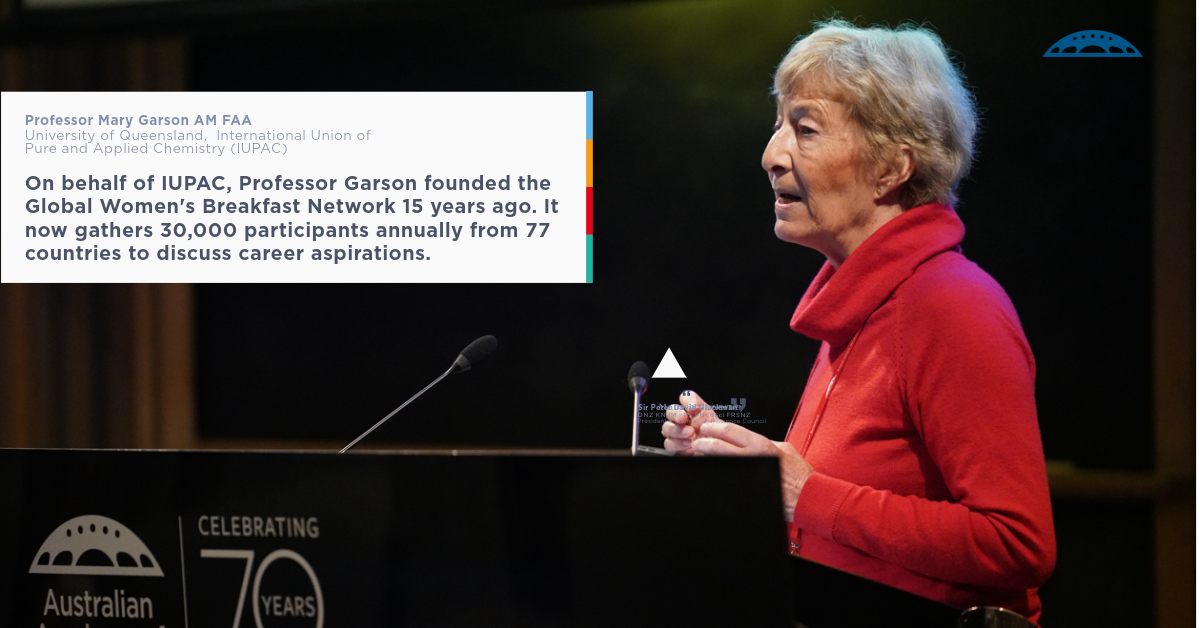
Professor Mary Garson AM FAA, a medicinal chemist who dove into marine science, described her work as “really about doing a molecular jigsaw puzzle ... identifying fragments by nuclear magnetic resonance and then joining them together.”
Next, Professor Arthur Georges FAA described his journey of discovery into the impact of environment on biological sex in reptiles.
Professor Ros Gleadow FAA then described how she first saw the Shine Dome, which they referred to as ‘the Martian Embassy’, in 1961 on a family holiday, and “never thought I would stand here”.
As for the work that led to this moment, she said, “I work on plants that poison you ... My interest has been working out why plants make these compounds, how they’ve evolved, and why there are more of them in crop plants.”
After morning tea, Professor Dmitri Golberg FAA explained how he developed novel imaging techniques to explore nanomaterials’ electromechanical, thermal, and opto-electronic properties in real time.
Along the way, his team created the smallest thermometer, and smallest carbon nanotube transistor, in the world.
“We got [a] Guiness World Record book signed saying that this [carbon nanotube thermometer] is the smallest thermometer in the world, it’s not very scientific but I think it was very impressive and encouraging for media for example,” he said.
Similar to Professor Garson earlier that morning, the next speaker, Professor Michael Kearney FAA, described his work as bringing together many puzzle pieces—in his case, to investigate how organisms are limited by their environments.
“The approach I’ve been taking is to look at the thermodynamic constraints because organisms can never escape the constraints of thermodynamics,” he said.
One example involved Professor Kearney and colleagues creating a map of where the cane toad could potentially disperse across Australia in the coming decades, which has been used for making management decisions.
Next, Professor Matthew Kiernan AM FAA FAHMS—who has introduced new techniques allowing ion channel function to be studied in vivo in humans, and which have helped identify mechanisms of disease and therapeutic targets—began his presentation by showing an Indigenous Australian rock art painting from 40,000 years ago of a network.
He said this was representative of his work: “a network of patients, a network of clinicians, clinician-researchers and international researchers.”
The next Fellow, animal venom researcher Professor Glenn King FAA, thanked the talented postdocs and students he has worked with during the past 30 years.
His work has seen a peptide produced by the Blue Mountains funnel-web spider now being used internationally as an eco-friendly insecticide.
But he said, “My most enduring scientific legacy will actually be my mentorship of these students and postdocs who are, after all, the next generation of science leaders in Australia.”
Attendees were then taken on a journey through the formation of the Earth as “a fireball that quickly became a water-ball” by Professor Zheng-Xiang Li FAA, who noted that underneath the changing surface of the planet was an evolving engine room.
Professor Li is a geoscientist whose work has led to paradigm shifts in our understanding of how this ‘engine’ works, and who codeveloped a model addressing the driving forces of tectonic plates.
Next, 2024 joint-Australian of the Year Professor Georgina Long AO FAA FAHMS explained how much remains on the journey to optimising cancer immunotherapy.
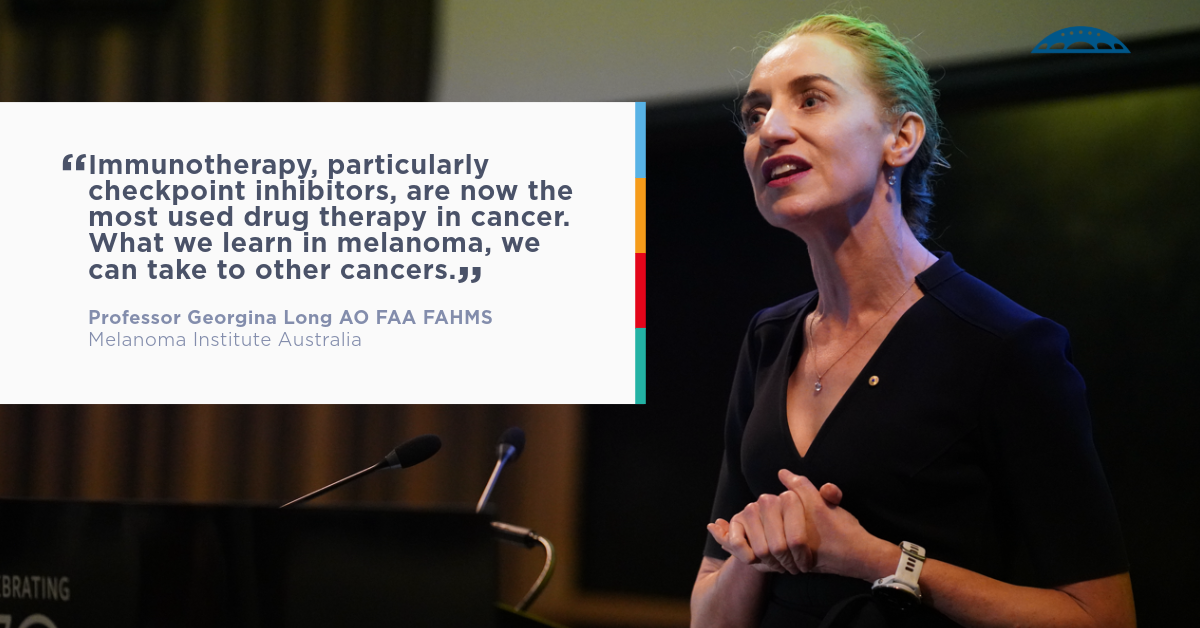
The oncologist and scientist has led clinical trials that revolutionised the way melanoma is treated worldwide and resulted in Australian Government funding of 10 new melanoma drugs that significantly increase survival.
But while survival rates have increased, Professor Long said the issue is still not solved: “Currently, where we are is probably equivalent to the 1960s and chemotherapy.”
The next Fellow, Professor Budiman Minasny FAA, shared that “When I was little, my mum always told me not to play on dirt, but I grew up studying soil science in Indonesia.”
While soil carbon sequestration is considered an economically viable method for mitigating climate change, he said soil science is much more than that.
“In order to tackle for example food security, water security, climate change, biodiversity and ecosystem security, we also need to tackle the soil itself.”
Professor Jose Polo FAA then shared his work exploring the boundaries of cellular reprogramming—including how he and colleagues have reconstructed reprogramming trajectories across different biological paradigms, including induced pluripotency, cancer and aging.
After a break for lunch, Professor Emma Johnston AO FAA FTSE, who was elected to the Academy in 2022, spoke.
An authority in marine science and conservation, Professor Johnston said the world is speeding up—and it's not just faster cars, faster drugs and faster communications.
“Natural ecosystems are also speeding up: metabolisms, evolution growth, life and death. And they are creating ecosystems we have not encountered before and not relied on before,” Professor Johnston said.
“The resulting dynamism requires us to shift our approach—our approach to research and science, our approach to conservation, and our approach to the way that we rely on ecosystems.” — Professor Emma Johnston.
Geophysicist Professor Hrvoje Tkalčić FAA then took us on a journey to the centre of the Earth—saying the inner core is really like a planet within our planet.
His group’s achievements include confirming the core’s solidity and the existence of the innermost inner core, obtaining images of the thermal convection cell at its top, and discovering the shuffling nature of its rotation.
Next, Professor Gene Tyson FAA described how “We are living in a microbial world. Microorganisms are the largest biomass on Earth ... but our understanding of these organisms has been limited.”
His achievements include demonstrating for the first time that metagenomic data could be used to reconstruct genomes directly from environmental samples, and helping to pioneer meta-omic approaches to better understand complex microbial communities.
These tools have been used to examine diverse microbial communities, from the corals on the Great Barrier Reef to the microbes responsible for the breakdown of permafrost in northern Sweden.
The next speaker, Professor Madeleine van Oppen FAA, shared some of her research involving microbial synthesis and climate adaptation of reef corals.
Massive congratulations to @spectacularia as one of the 2024 elected Australian Academy of Science Fellows party face emoji heart emoji I am so privileged to have you as my mentor for > 9 years! https://t.co/ZxTkaWtN2h
— Wing Y Chan (@wing_coral) September 10, 2024
Professor Lianzhou Wang FAA then described how material innovation has been the cornerstone of human civilisation—supporting us throughout the Stone Age and into the Quantum Era—and shared his team’s research journey to develop new semiconductor materials.
Corresponding Member Professor Eric Warrant FAA was then welcomed to the stage, where he greeted his family who were watching the livestream from their home in Sweden.
His research has furthered our understanding of the highly sensitive eye designs and visual neural circuitry that allows creatures to see in the dark.
“By teaching the [elephant hawkmoth] to associate colours with food, we were able to determine that they could see colour at light levels where our colour visual was completely gone,” he said.
“This was the first animal to be shown to have nocturnal colour vision.”
The discoveries his team has made in insects have been employed by the company Toyota to optimise cameras they hope will help drivers identify obstacles.
Speaking next, Professor Willy Zwaenepoel FAA FTSE described himself as “an accidental scientist”.
“I grew up in a small town in Belgium. My brother and I were first generation high school graduates, let alone university students, and I was studying electrical engineering because I thought I could get a job that way.”
He worked ended up in the ever-changing world of software systems, with achievements including ‘distributed shared memory,’ “which makes programming them much simpler,” he said.
Frocking up
The final event of Wednesday evening was the Gala Dinner at the National Arboretum, where the Academy’s most prestigious medals for 2023 and 2024 were presented. Read the President’s Gala Dinner speech.
Watch all new Fellows’ videos on their Academy profile pages.
Day 2: Tuesday 10 September
On the second day of Science at the Shine Dome, out of the frosty Canberra morning, came 'the batman'.
Continuing the presentations by Fellows elected in 2023, Corresponding Member Professor Linfa Wang FAA FTSE shared with the assembled crowd the lessons we can learn from bats—beyond viruses and pandemics.
Professor Wang began by thanking Professor Peter Doherty AC FAA FAHMS FRS as his nominator to the Academy Fellowship.
“To have a Nobel laureate believe in your science and support your science for the last two decades—it’s really a privilege,” Professor Wang said.
He also noted the significance of today’s date, having started his career researching bat-borne viruses exactly 30 years ago, on 10 September 1994.
In the decades since that first day, Professor Wang went on to study the Hendra and Nipah viruses, and the viruses associated with SARS, MERS, Ebola and Covid-19.
Something he said he found particularly fascinating about bats is their ability to remain healthy throughout their extraordinarily long lifespans—including their resistance to cancer, and how they carry viruses without succumbing to disease.
The working theory is that these features are an evolutionary byproduct from having to cope with the stress exerted on their bodies when they fly.
“So on one hand, they have elevated defence genes ... [and] they have many mechanisms to damper the over-reaction, or over-immune response.”
These findings have seen much of his research focus expand beyond infectious disease—to see what bats can teach us about metabolism, DNA damage responses, senescence, inflammation and heat shock.
Before morning tea, other Fellows elected in 2023 took us on a journey from the skies to the soil—covering drug discovery inspired by natural products, electrocatalysis for energy conversion, and plant vascular systems.
One Fellow, Professor Brajesh Singh FAA, explained how healthy soil is crucial for healthy societies, noting almost every United Nations’ Sustainable Development Goal is dependent on having healthy soils.
Not only do most beneficial pathogens in our bodies—from our gut to our skin—have their origins in the soil, its health is also crucial for the majority of our food and compounds used in medicines, he said.
“The majority of global biodiversity lives in the soil and that’s why their activities are crucial. No terrestrial life is possible without healthy and functioning soil biodiversity,” Professor Singh said.
Professor Leslie Weston FAA also shared her research into how invasive plants step up to the challenge of changing climatic conditions.
Early in her career, Professor Weston said she was told it was important to ‘know your enemy’ to succeed in crop and landscape protection.
She went on to thoroughly investigate some of the threats to Australia’s native flora and fauna—studying the emergence, identification and invasion history of invasive pests, including prickly paddy melon, citron melon, panic grass and Paterson’s curse.
This has included studying the evolution of weapons they develop to protect themselves against predators.
After developing a number of molecular approaches to study these plants, Professor Weston and colleagues discovered a novel group of chemicals in the roots of Paterson’s curse that protect it against bacteria, fungi and other plants, along with at least 20 different alkaloids that accumulate in the leaves, flowers and stems, and are toxic to grazing livestock.
She stressed the importance of using genomics to understand these invasive weeds, noting only around 30 of these invasive plant genomes have been sequenced to-date.
“This emerging technology should help us study the reasons why these plants are so environmentally important and have adapted to our climatic conditions across the globe,” Professor Weston said.
2024 Fellows formally admitted to the Academy
⏰ 1.30PM AEST Our newly elected Fellows are being admitted to the Academy. Each of their personalised videos will be shown as they sign the historic Charter Book in our 70th anniversary year. Did you know that HRH Prince Philip was present at the Shine Dome when Her Majesty the… pic.twitter.com/uZKSPgnqVy
— Australian Academy of Science (@Science_Academy) September 10, 2024
Watch all new Fellows’ videos on their Academy profile pages.
Fellows elected in 2024 were invited to add their signatures to the Charter Book:
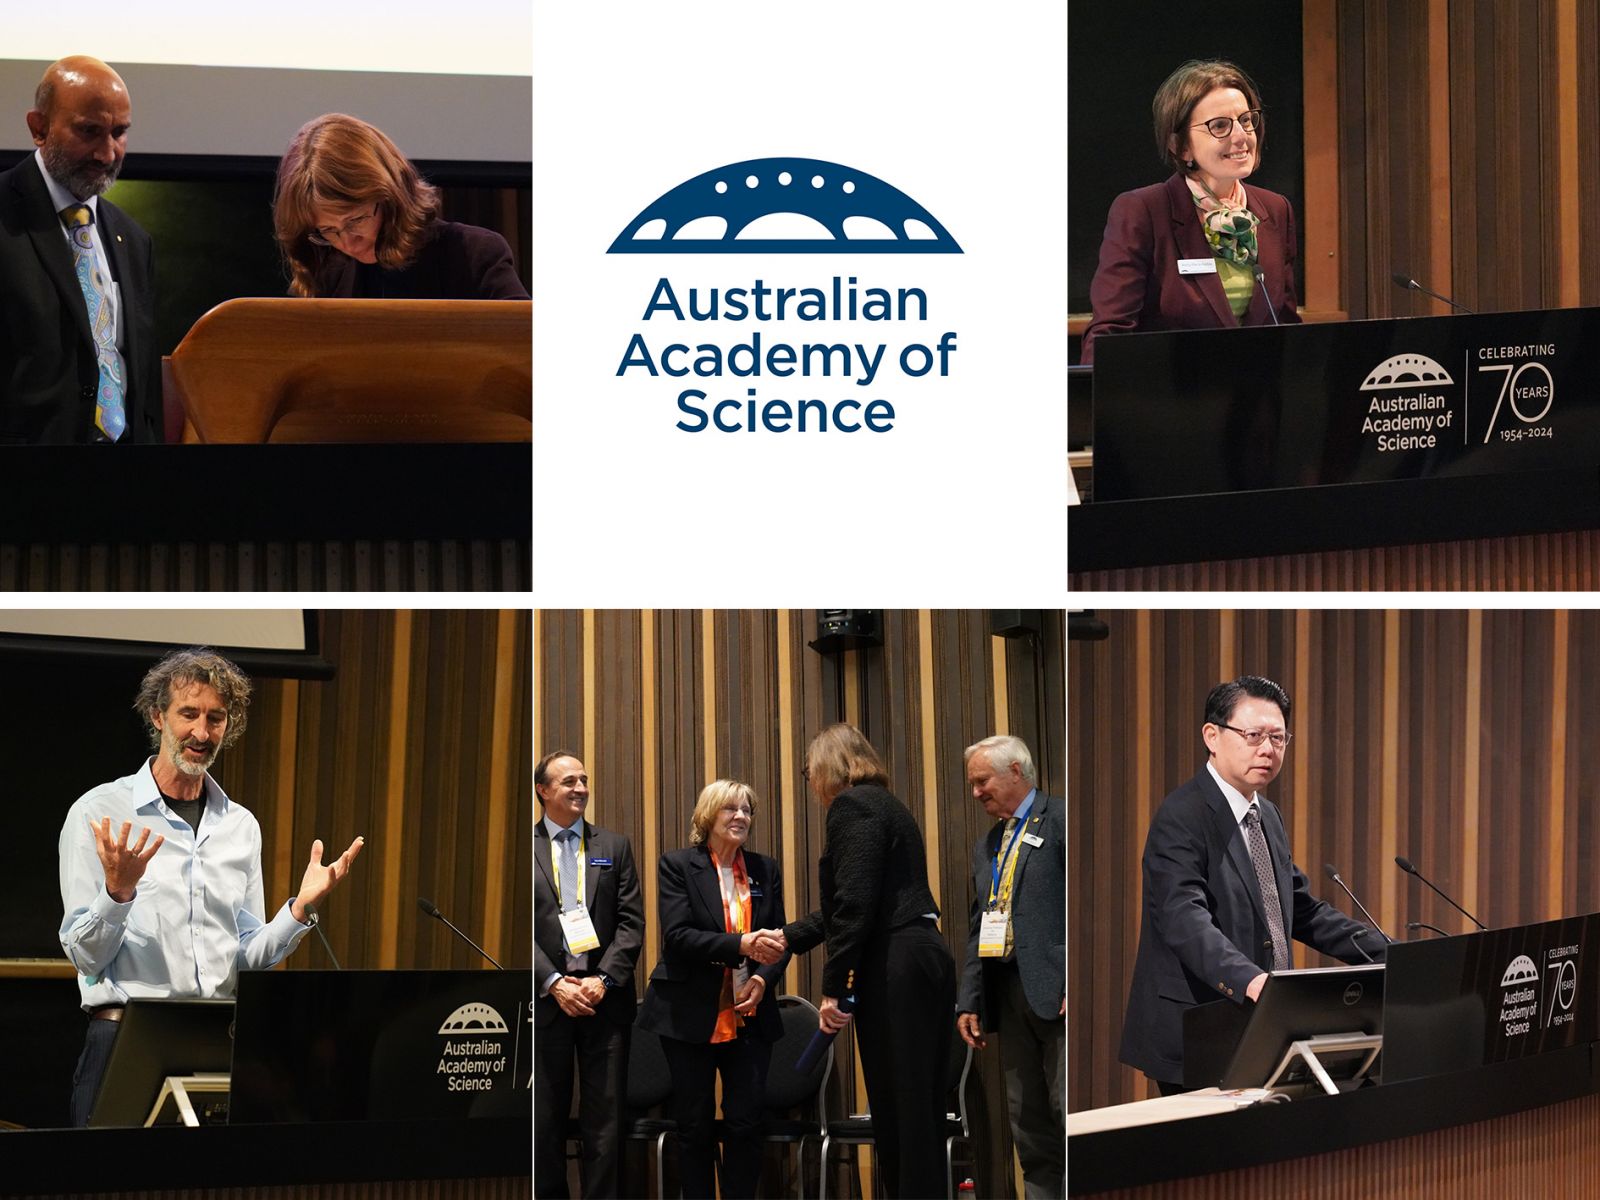
- Professor Nerilie Abram FAA, Australian National University
- Professor Andrew Blakers FAA FTSE, Australian National University
- Professor Rachelle Buchbinder AO FAA FAHMS, Monash University
- Professor Kylie Catchpole FAA FTSE, Australian National University
- Emerita Professor Mary Garson AM FAA, University of Queensland
- Professor Arthur Georges FAA, University of Canberra
- Professor Roslyn Gleadow FAA, Monash University
- Professor Dmitri Golberg FAA, Queensland University of Technology
- Professor Michael Kearney FAA, University of Melbourne
- Professor Matthew Kiernan AM FAA FAHMS, Neuroscience Research Australia
- Professor Glenn King FAA, University of Queensland
- Professor Mark Krumholz FAA, Australian National University
- Professor Zheng-Xiang Li FAA, Curtin University
- Professor Georgina Long AO FAA FAHMS, Melanoma Institute Australia
- Professor Budiman Minasny FAA, University of Sydney
- Professor Jose Polo FAA, University of Adelaide
- Professor Hrvoje Tkalčić FAA, Australian National University
- Professor Gene Tyson FAA, Queensland University of Technology
- Professor Madeleine van Oppen FAA, Australian Institute of Marine Science
- Professor Lianzhou Wang FAA, University of Queensland
- Professor Eric Warrant FAA, Lund University, Sweden
- Professor Willy Zwaenepoel FAA FTSE, University of Sydney
Fellows who had not yet signed the Charter Book also had the chance to do so:
- Professor Tim Brodribb FAA, University of Tasmania (elected 2023)
- Professor Emma Johnston AO FAA FTSE, University of Sydney (elected 2022)
- Professor Anne Dell FAA FRS, Imperial College London, UK (Corresponding Member 2022)
- Professor Peter Corke FAA FTSE, Queensland University of Technology (elected 2019)
- Professor Ben Andrews FAA, Australian National University (elected 2013)
Launch of Innovate Reconciliation Action Plan
Professor Chennupati Jagadish AC PresAA FREng FTSE delivered the President’s address, which included welcoming the newest additions to the Academy Fellowship.
“I spend much of my time looking at nanostructures and observing the world at a different scale,” Professor Jagadish said.
“So, the opportunity to sit in this grand hall and hear about the wonders of our universe, how viruses multiply, novel ways to create clean energy, and the complexity and importance of the soil beneath our feet, is truly mind blowing.”
Professor Jagadish then moved to launch the Academy’s Innovate Reconciliation Action Plan (RAP).
RAP Working Group Member and Academy Fellow John Patrick FAA was invited to speak, where he noted that “Reconciliation is everyone’s business,” and stressed the importance of both informed cultural awareness and capability, and the need for people to change the status quo.
This flowed into an on-stage discussion with Bidjara descendant Ms Michelle Hobbs, from Griffith University, and Birri Gubba man Dr Jordan Pitt, from the University of Sydney.
Kamilaroi Water Scientist, Professor Bradley Moggridge from the University of Technology Sydney, joined via video link.
They touched on the importance of having role models and good mentors.
Ms Hobbs, who received the Aboriginal and Torres Strait Islander Scientist Award in 2023, said she chose to pursue ecology partly because of her natural fascination with plants and animals after growing up on a farm, combined with having wonderful role models.
“I saw my dad go on a journey from being a farmer to being a mature-age student at university and becoming an academic for a career, quite late in life,” Ms Hobbs said.
“Also, I had amazing female science teachers at school who encouraged me so having those role models made me able to see myself in those positions. However, I never had Indigenous role models in science and so for a long time it was quite difficult to picture myself being not just a woman scientist but an Indigenous scientist.
“I’m very fortunate to have had mentors and people encouraging me along the way, including Brad, who’s here today, smoothing the way for me and encouraging me, including to apply for the award that I won a couple of years ago.”
Download the plan (PDF, 9MB)
May 2024 – May 2026
See our progress towards reconciliation.
Day 1: Monday 9 September
The first day of Science at the Shine Dome saw around 180 people gathering to witness 20 leading scientists being formally admitted to the Academy.
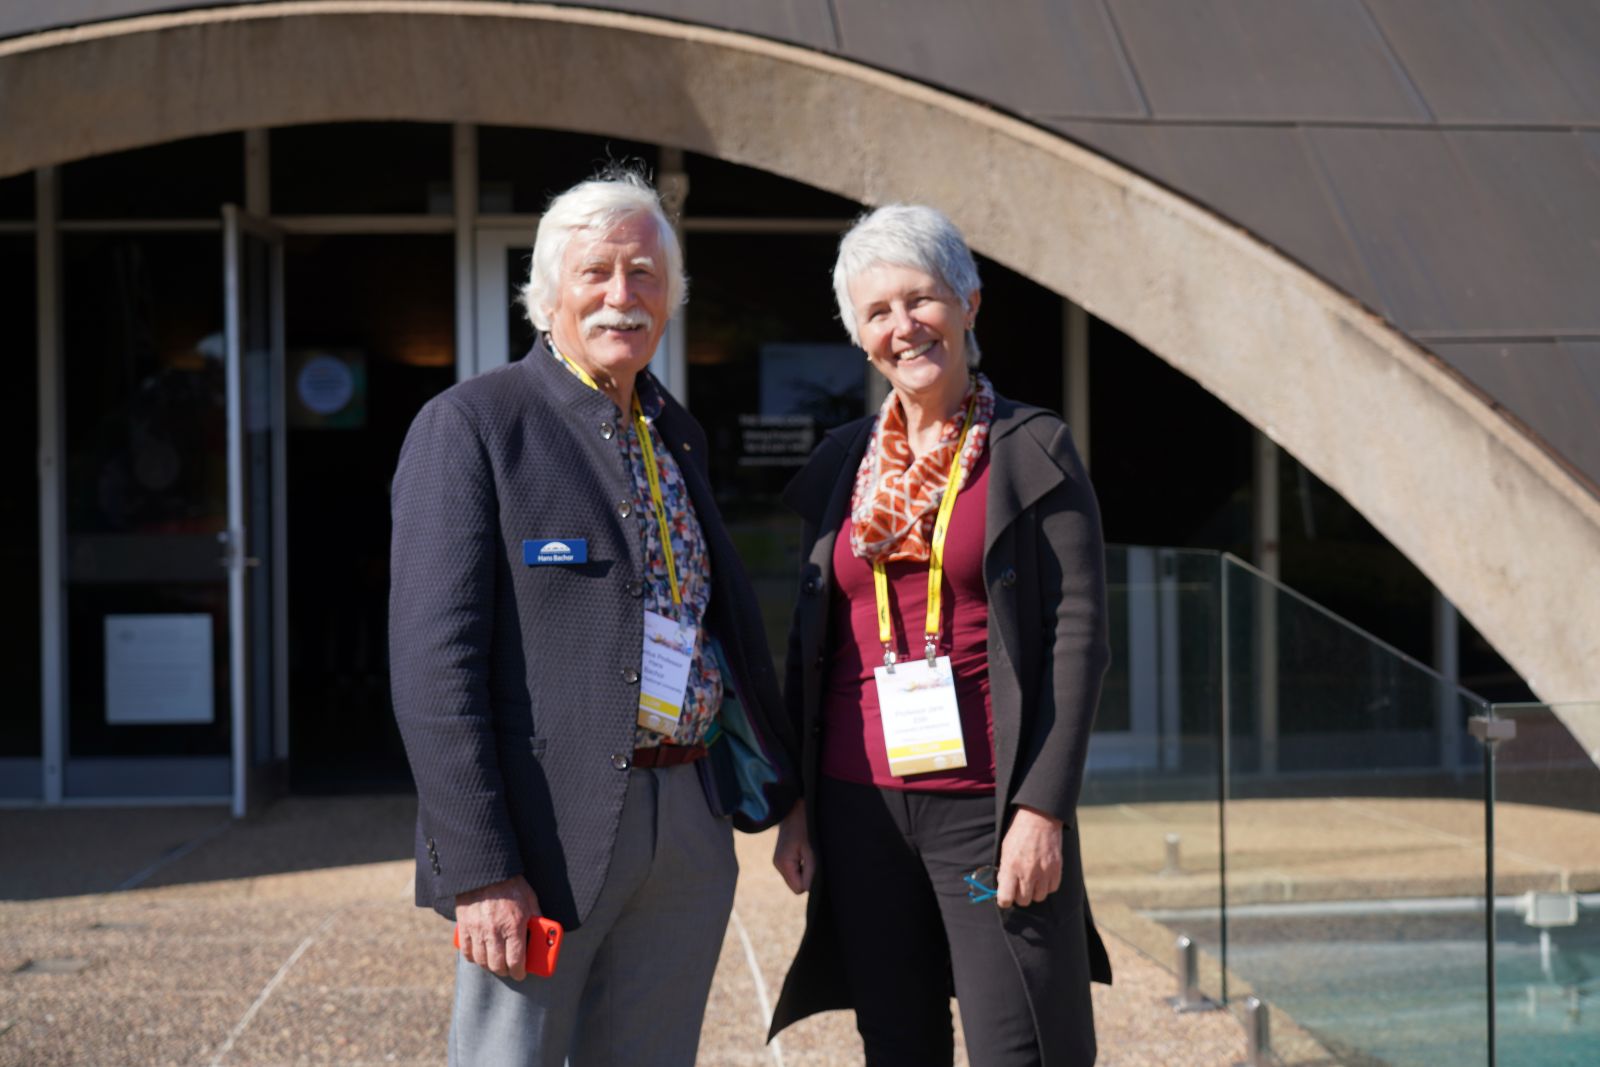
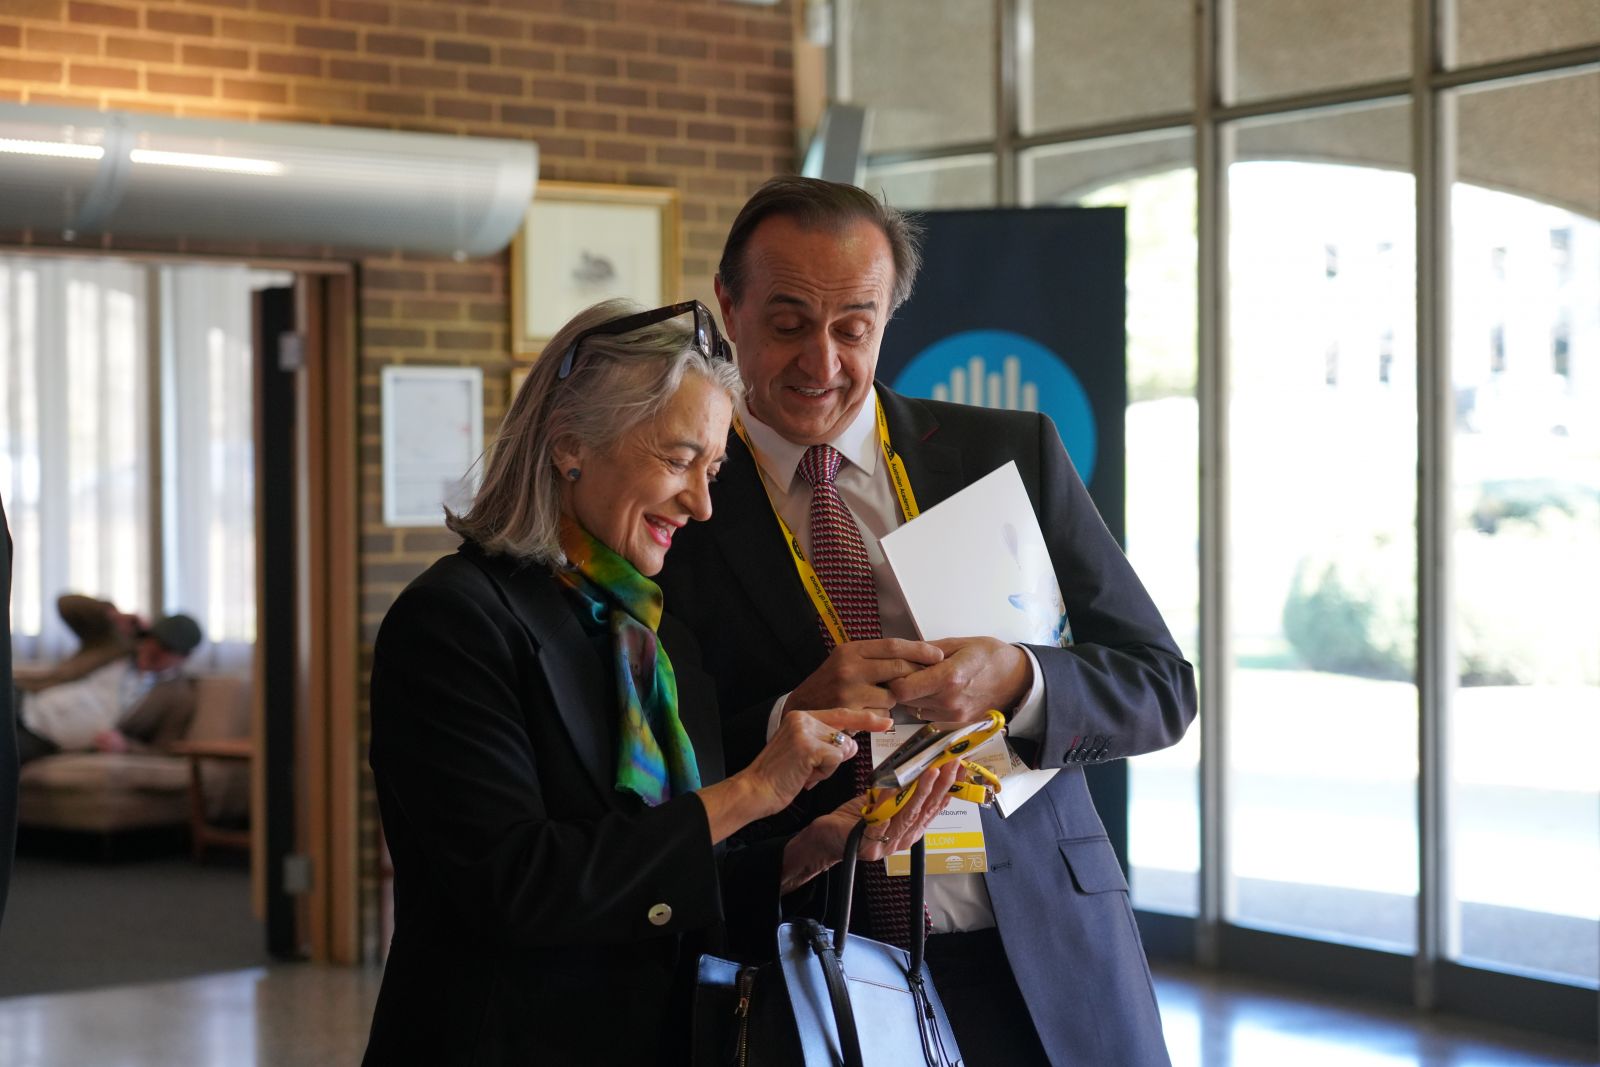
The event was opened with a Welcome to Country by Ngunnawal Elder Aunty Violet Sheridan.
This was followed by a welcome speech by Academy President Professor Chennupati Jagadish AC PresAA FREng FTSE.
“The Academy is proud to bring science to the service of the nation, and to have made substantial contributions to shaping Australian and global science over our 70-year history,” Professor Jagadish said.
He noted that Australia has a deep reservoir of talent in the sciences, including some of the world's most eminent researchers, as he welcomed the 2023 Fellows.
“Each Fellow is nominated by their peers and chosen through a rigorous election process,” Professor Jagadish said.
“Today, you join our Fellowship, who are collectively the brains trust of the nation—a true national treasure.”
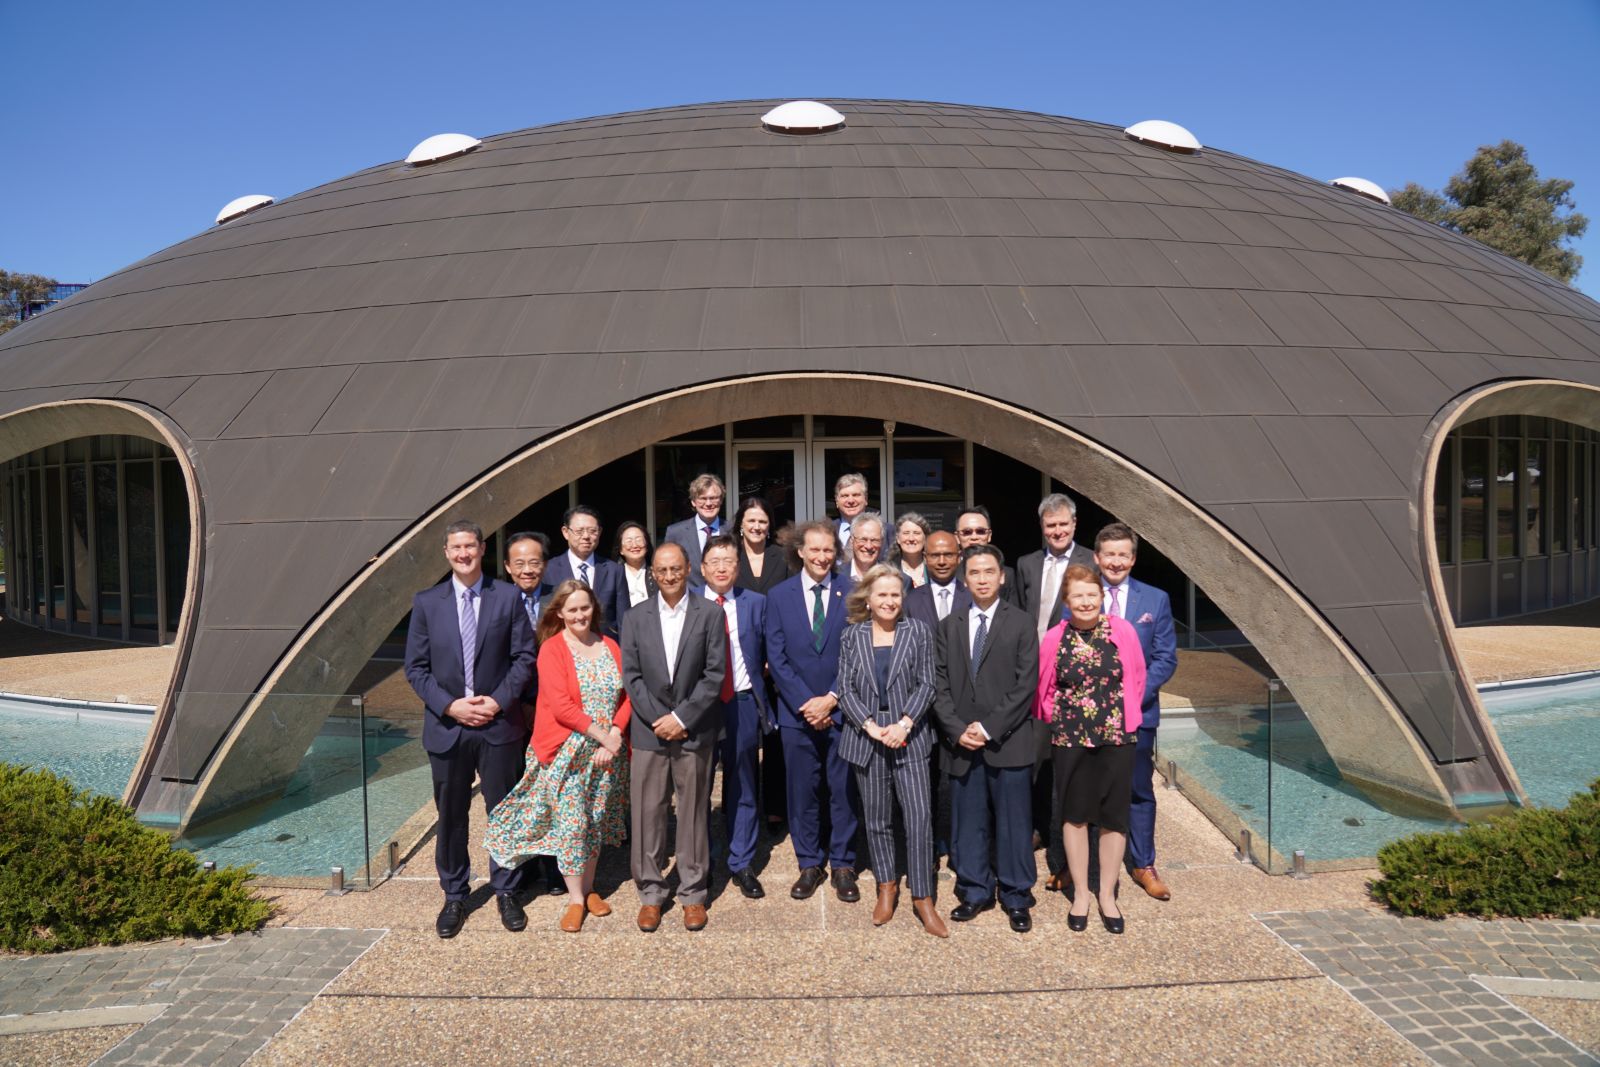
On Monday, the Academy formally welcomed to the Fellowship:
- Professor Liming Dai FAA, UNSW Sydney
- Professor Mariapia Degli-Esposti FAA FAHMS, Monash University
- Professor Zaiping Guo FAA FTSE, University of Adelaide
- Professor Elaine Holmes FAA, Murdoch University
- Professor David Keith FAA, UNSW Sydney
- Professor David Komander FAA FRS, WEHI
- Professor Sharon Lewin AO FAA FAHMS, University of Melbourne
- Professor Jian Li FAA, Monash University
- Professor Gareth McKinley FAA FRS, Massachusetts Institute of Technology (MIT), United States
- Professor Belinda Medlyn FAA, Western Sydney University
- Professor Louis Moresi FAA, Australian National University
- Professor Rich Payne FAA, University of Sydney
- Professor Shizhang Qiao FAA, University of Adelaide
- Professor Brajesh Singh FAA, Western Sydney University
- Professor Peter Taylor FAA, University of Melbourne
- Professor Linfa Wang FAA FTSE, Duke-NUS Medical School, Singapore
- Professor Leslie Weston FAA, Charles Sturt University
- Professor Andrew Wilks FAA FTSE FAHMS, SYNthesis BioVentures
- Professor Xinghuo Yu FAA, RMIT University
- Professor Pankaj Sah FAA FAHMS, University of Queensland.
These Fellows have all made significant achievements in diverse fields—from delivering a novel antibiotic to combat life-threatening superbugs, designing stretchable liquids used on the International Space Station, and battling invasive species.
A video was shown for each new Fellow to as an introduction to their research.
Watch all new Fellows’ videos on their Academy profile pages.
2023 Fellows formally admitted
During the day, the 2023 Fellows signed the Charter Book, signifying their formal admission to the Australian Academy of Science.
Their signatures join those of every Fellow of the Academy throughout the past 70 years, including some of the world's most esteemed scientists.
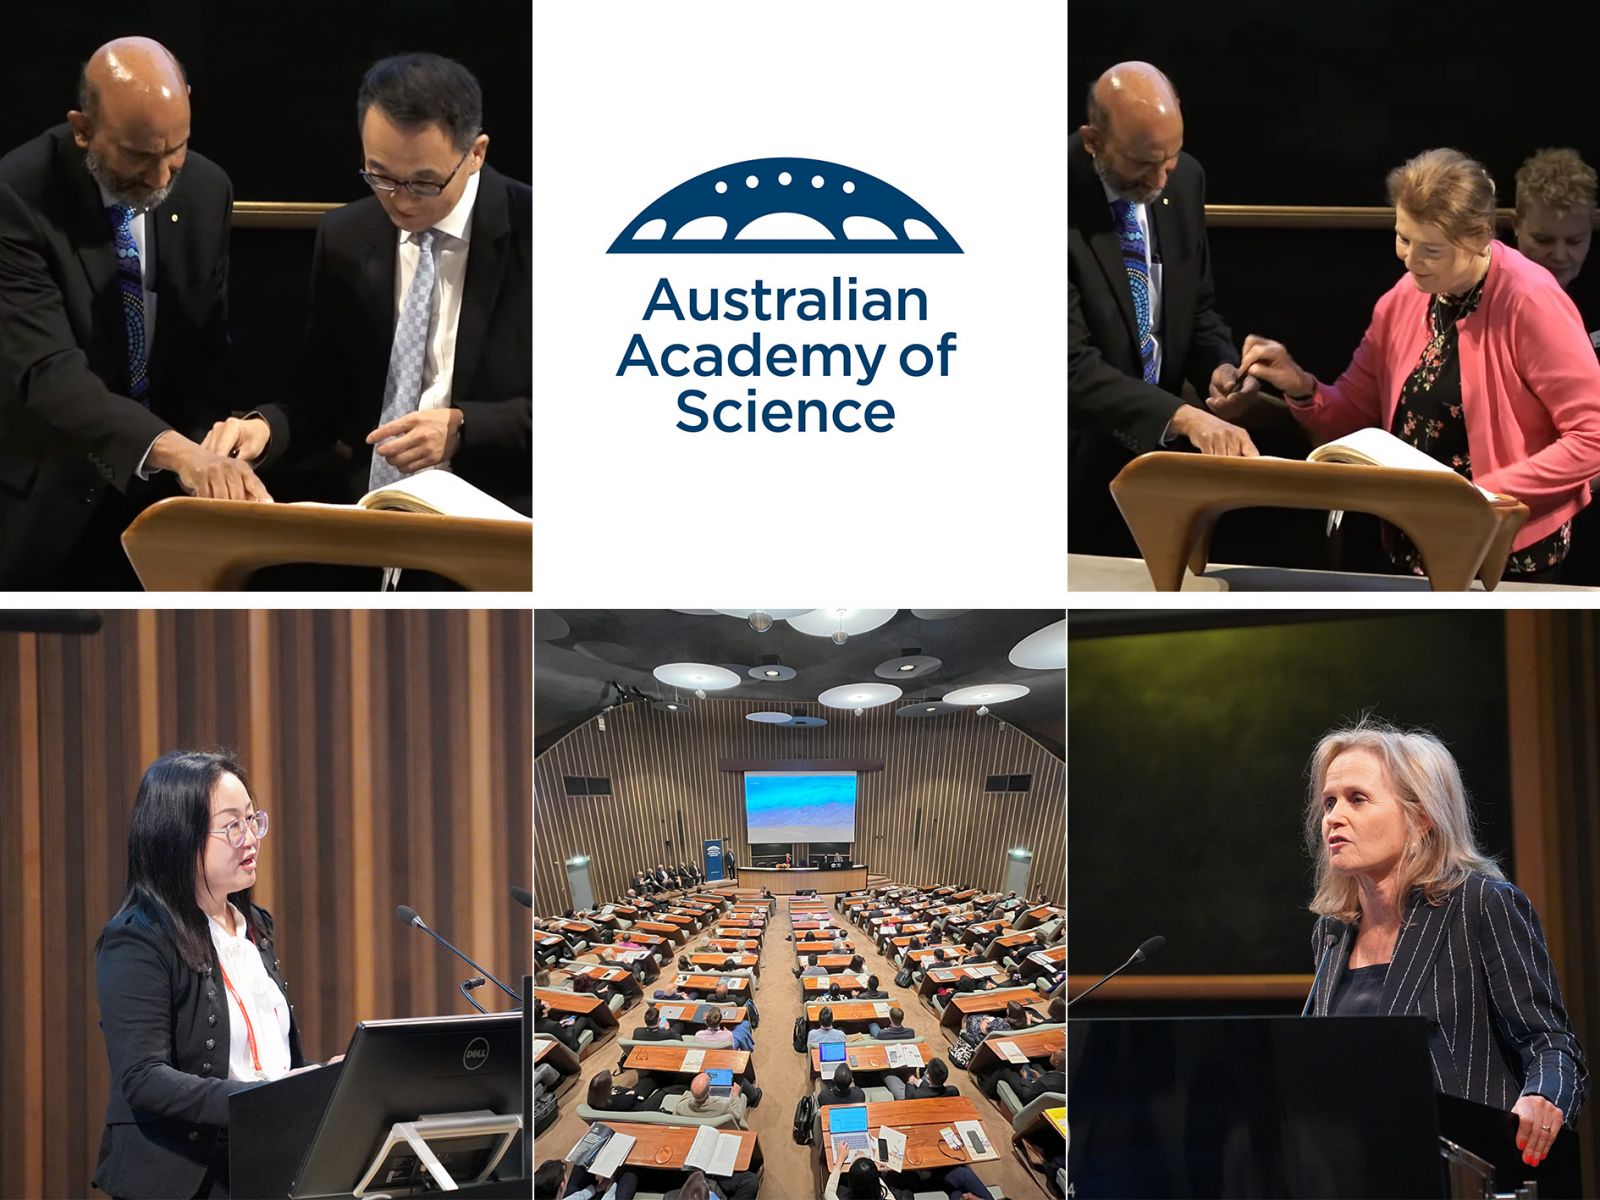
Condensing decades of work into 10-minute presentations
The 2023 Fellows each had a chance to give 10-minute presentations on their work, followed by a Q&A with the audience.
Professor Andrew Wilks noted the personal significance of the occasion at the beginning of his presentation.
“I had the great fortune to look at the charter book before and see some of the names of my mentors and heroes,” he said.
Professor Wilks added that earlier that day, he also met two scientists who had had great impacts on his career—while in the queue for the gelato cart hired for the event.
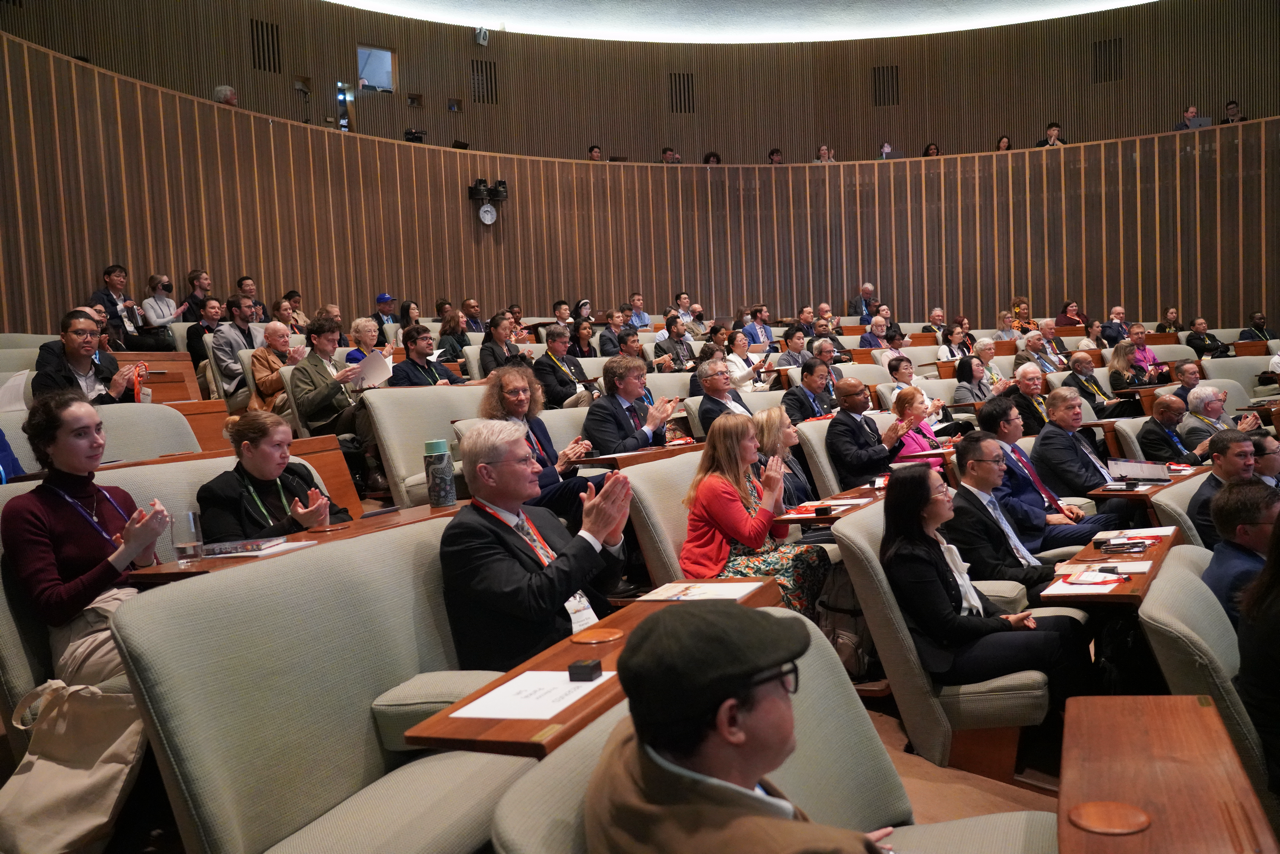
Expanding networks
Attendees, Fellows and other scientists continued the conversation online.
Do yourself a favor & watch all these videos. Beautifully done, they tell inspirational stories of the very best of science & scientists in an accessible way. Although they will barely make the news, these quiet superstars confront the most important, troubling & desperately… https://t.co/8LyrWzIOuV
— Prof Brendan Crabb (@CrabbBrendan) September 9, 2024
Monday also marked the first meeting of the Asia-Pacific Academic Mentoring Program, which connects early-career researchers with senior science mentors to guide young scientists from developing nations within the region to become future leaders in academia.
Speaking to the participants, Professor Jagadish emphasised the importance of more senior scientists guiding those who come after them,
“If it were not for my mentors, I would not be here today,” he said.
More than 100 early- and mid-career researchers (EMCRs) from across Australia registered to attend Science at the Shine Dome 2024, with an EMCR networking function being held Monday night on the grounds of Ian Potter House.
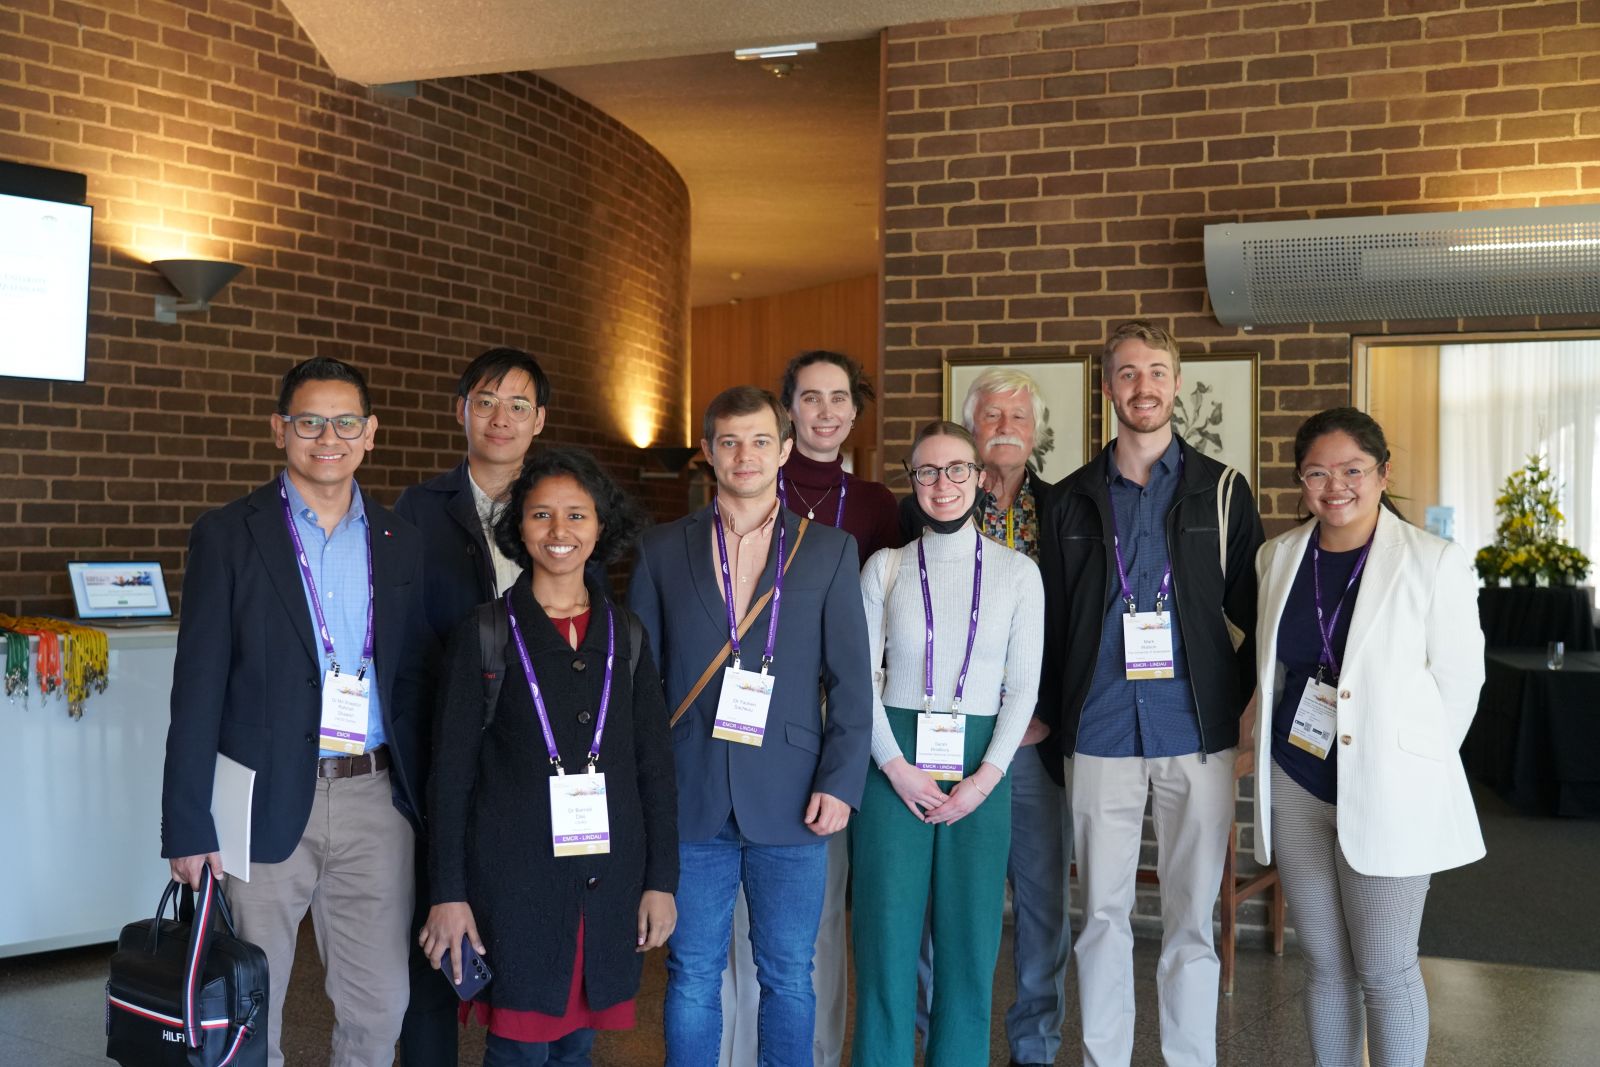
About our artwork for Science at the Shine Dome 2024
In celebration of Australian science and Science at the Shine Dome 2024, the Academy’s 70th anniversary montage image showcases scientific disciplines that impact us every day. It includes elements representing states and the ACT, with a nod to the 70-year history of the Australian Academy of Science. Represented in the lower right corner (left to right) are three key historical figures generated from portraits using AI: Sir Ian Potter (elected in 1978), a significant benefactor of Australian scientific institutions and Academy Fellow; Professor Dorothy Hill, the first female Fellow (1956) and first female Academy President (1970); and Professor Sir Mark Oliphant, the Academy’s founding President (1954).
Each of the following is represented by iconic buildings and emblems:
- ACT – the Shine Dome and Parliament House
- NSW – the Sydney Opera House and harbour
- QLD – the Great Barrier Reef
- SA – Sturt’s desert pea
- TAS – Tasmanian devil and Cradle Mountain
- VIC – the Melbourne Observatory
- WA – black swans and the kangaroo paw plant
The butterfly illustration was sourced from the Academy archives, ‘Australian Lepidoptera and their transformations’. Professor Mark Oliphant’s image is also from the Academy archives. Help make history with us by supporting the digitisation of our valuable and unique archives.
With thanks for the following images to:
- UNSW: M2 CubeSat image, featured in the Australia in Space Decadal Plan. This satellite was almost entirely designed and built in Australia in a collaboration between the Air Force, UNSW Canberra Space and a domestic supply chain of around 30 Australian companies.
- ANSTO: Scientists Dr Pauline Treble and Ms Carol Taros collecting water samples in the Jenolan caves, featured in the Women in STEM Decadal Plan.
- A. Chinn (copyright Commonwealth of Australia, (Great Barrier Reef Marine Park Authority): Research scientist taking note of coral growth on Wheeler Reef, featured in the Reef Futures Roundtables Report.
- Biodiversity library (page/50449604): Image of the white flower, Illustrationes florae Novae Hollandiae, sive Icones generum quae in prodromo florae Novae Hollandiae et Insulae Van Diemen descripsit Robertus Brown.
- Ian Potter Foundation: Sir Ian Potter’s portrait
- National Archives of Australia: Professor Dorothy Hill
The montage image was created by graphic designer Leah Albert for the Australian Academy of Science.
More about Science at the Shine Dome 2024
- Read the event highlights
- Watch the livestreams
- Read the event program (PDF 8mb)
- Visit the event website
- Follow the action on X (formerly Twitter): #ShineDome24 and Academy.
Diversity and Inclusion Advisory Committee
The primary objective of the Committee is to act as an agent of and as an advisory body to the Academy’s Executive Committee (EXCOM) in relation to diversity and inclusion (D&I) strategy, policy, activities and related matters at the Academy. DIACOM operates in accordance with a Charter and Terms of Reference.
Alan Andersen
- FAA
- Chairperson
Janin Bredehoeft
- SAGE, External member
Nalini Joshi
- AO FAA
- Fellows’ representative
Jane O'Leary
- Diversity Council of Australia, External member
Jordan Pitt
- University of Sydney, Early- and mid-career (EMCR) representative
Maithili Sashindranath
- Monash University, EMCR representative
Chennupati Jagadish
- AC PresAA FRS FREng FTSE
- President, ex-officio
Melissa Abberton
- Staff, Chief Operating Officer
Committee—Brian Anderson Medal
Purpose: To advise Council on the award of the Medal, in accordance with Standing Order XXII.
- Professor Graham Goodwin AO FAA FRS FTSE - Chair
- Associate Professor Joe West - Member
- Professor Ian Petersen FAA - Member
- Professor Gill Dobbie FRNZ - Member
- Professor Shazia Sadiq FTSE - Member
Committee—The WH Gladstones Population and Environment Fund
Purpose: To advise Council on the award of the Award, in accordance with Standing Order XXII.
- Professor John Church AO FAA FTSE - Chair
- Dr Xuan Li - Member
- Emeritus Professor Mark Howden AC FAA FTSE - Member
- Professor Susan Laurance - Member
- Professor Jurg Keller - Member